Fig. 9
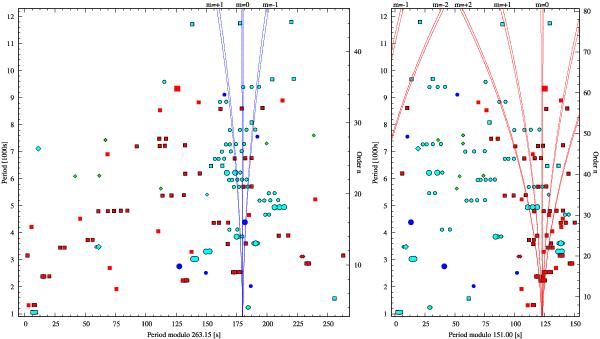
Échelle diagram for ℓ = 1 (left) and ℓ = 2 (right). Detected modes are marked according to their period on the abscissa, with a cyclic folding on the asymptotic period on the ordinate axis. The right-hand axis gives the order n of the mode, according to the asymptotic relation (Eq. (4)). Blue circles mark modes identified as ℓ = 1, with outlined cyan circles indicating those that appear in multiplets. Red squares mark ℓ = 2 modes, again with outlined points indicating multiplets. Cyan diamonds mark trapped ℓ = 1 modes, red diamonds mark trapped ℓ = 2 modes, and green diamonds mark modes that do not fit either sequence. Outlined cyan squares indicate modes that can be either ℓ = 1 or ℓ = 2. The high-amplitude peaks (A > 250 ppm) in the full dataset are marked with enlarged symbols.
Current usage metrics show cumulative count of Article Views (full-text article views including HTML views, PDF and ePub downloads, according to the available data) and Abstracts Views on Vision4Press platform.
Data correspond to usage on the plateform after 2015. The current usage metrics is available 48-96 hours after online publication and is updated daily on week days.
Initial download of the metrics may take a while.