Fig. 2
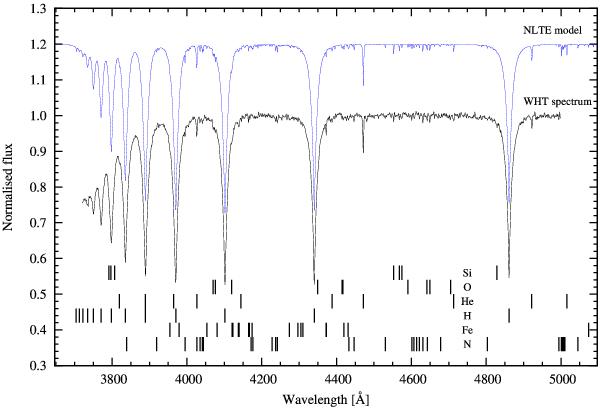
Mean WHT spectrum of KIC 10553698 after correcting for the orbital velocity. The S/N in this mean spectrum peaks at ~200, and many weak metal lines can be distinguished in addition to the strong Balmer lines and He i lines at 4472 and 4026 Å. The continuum of the normalised spectrum was sampled individually in 100 Å sections. Shifted up by 0.2 is the model fit computed with tlusty/XTgrid. Line identifications are given for lines stronger than 30 mÅ in the model. The final parameters for this model fit are given in Table 3.
Current usage metrics show cumulative count of Article Views (full-text article views including HTML views, PDF and ePub downloads, according to the available data) and Abstracts Views on Vision4Press platform.
Data correspond to usage on the plateform after 2015. The current usage metrics is available 48-96 hours after online publication and is updated daily on week days.
Initial download of the metrics may take a while.