Fig. 7
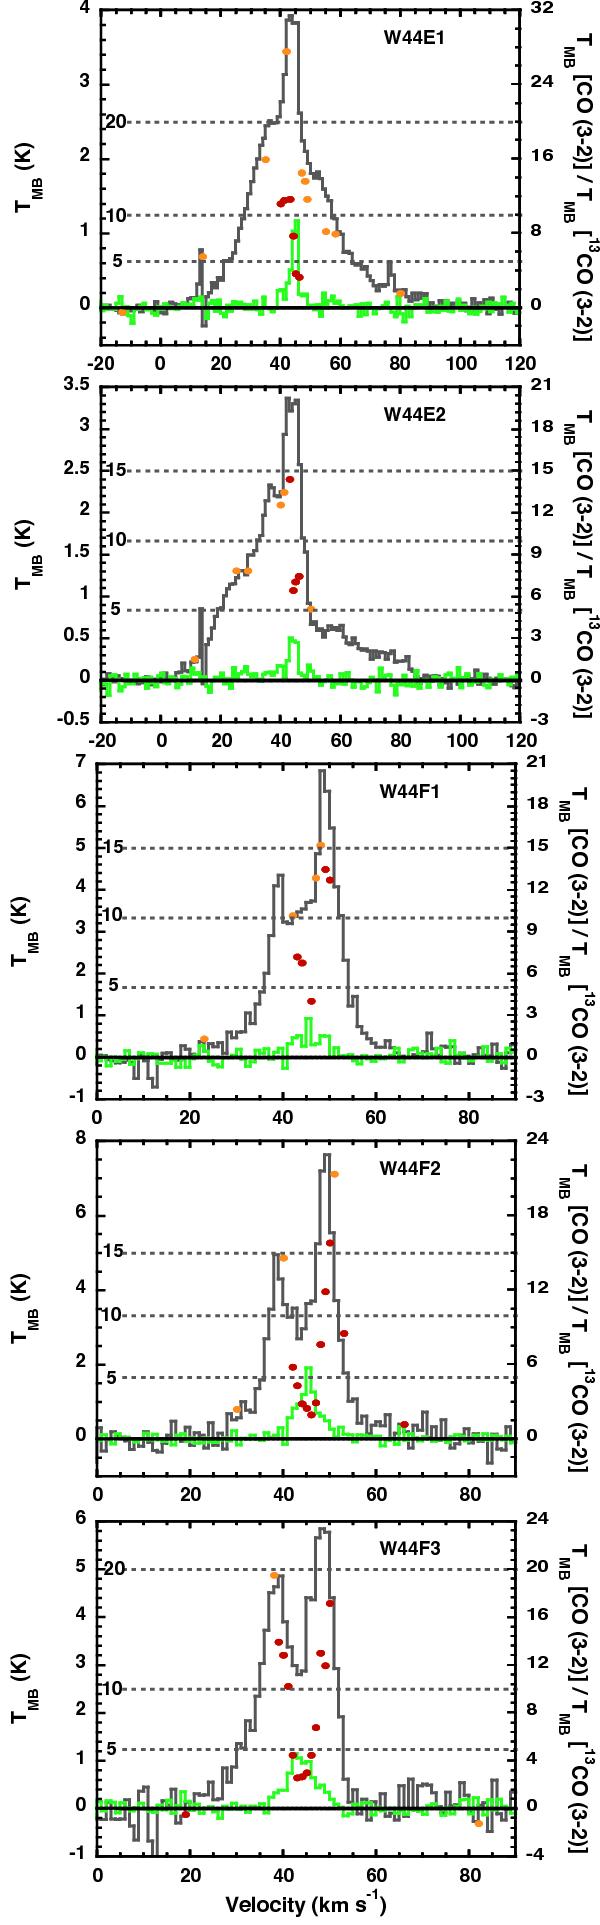
Spectra (in TMB) of 12CO (3–2) (grey, left ordinate) and 13CO (3–2) (green, left ordinate) together with the line temperature ratio of 12CO (3–2)/13CO (3–2) (dots, right ordinate). The ratio is shown for 13CO (3–2) line temperatures higher than 2σ (orange dots) and 3σ (red dots). Grey dotted lines indicate values of the temperature ratio as displayed on the left-hand side of these lines. The positions displayed are W44E1 and W44E2, and W44F1, W44F2, and W44F3 (top to bottom). The corresponding values of the optical thickness in the line wings are in the range of 3–7.
Current usage metrics show cumulative count of Article Views (full-text article views including HTML views, PDF and ePub downloads, according to the available data) and Abstracts Views on Vision4Press platform.
Data correspond to usage on the plateform after 2015. The current usage metrics is available 48-96 hours after online publication and is updated daily on week days.
Initial download of the metrics may take a while.