Fig. 5
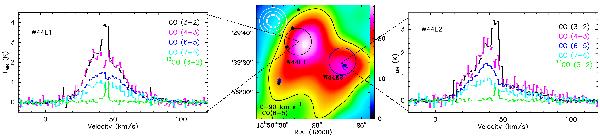
Central Panel: positions of our analysis in W44E (W44E1: black
circle, W44E2: blue circle) on the velocity-integrated CO (6–5) emission
( integrated between 0 km s-1 and 90 km s-1) convolved to the CO
(3–2) angular resolution of 18
integrated between 0 km s-1 and 90 km s-1) convolved to the CO
(3–2) angular resolution of 18  (colour background) with
half-maximum contour in black. The wedge unit is K km s-1. The blue and black
circles indicate the APEX beam size of our observations in CO (3–2). The APEX beam
sizes of our CO (3–2), CO (4–3), CO (6–5), and CO (7–6) observations are also
provided (upper left corner, see also Table 1). The black and light blue hexagons
mark the position of the OH masers observed by Claussen et al. (1997) and Hoffman et al.
(2005). Left Panel: spectra observed in the position W44E1
(in TMB), CO (3–2), black; CO (4–3),
pink; CO (6–5), dark blue; CO (7–6), light blue; 13CO (3–2), green. The CO
spectral resolution is 1.0 km s-1 for all lines. Right panel:
spectra observed in the position W44E2, same colours as in the left
panel.
(colour background) with
half-maximum contour in black. The wedge unit is K km s-1. The blue and black
circles indicate the APEX beam size of our observations in CO (3–2). The APEX beam
sizes of our CO (3–2), CO (4–3), CO (6–5), and CO (7–6) observations are also
provided (upper left corner, see also Table 1). The black and light blue hexagons
mark the position of the OH masers observed by Claussen et al. (1997) and Hoffman et al.
(2005). Left Panel: spectra observed in the position W44E1
(in TMB), CO (3–2), black; CO (4–3),
pink; CO (6–5), dark blue; CO (7–6), light blue; 13CO (3–2), green. The CO
spectral resolution is 1.0 km s-1 for all lines. Right panel:
spectra observed in the position W44E2, same colours as in the left
panel.
Current usage metrics show cumulative count of Article Views (full-text article views including HTML views, PDF and ePub downloads, according to the available data) and Abstracts Views on Vision4Press platform.
Data correspond to usage on the plateform after 2015. The current usage metrics is available 48-96 hours after online publication and is updated daily on week days.
Initial download of the metrics may take a while.