Fig. 3
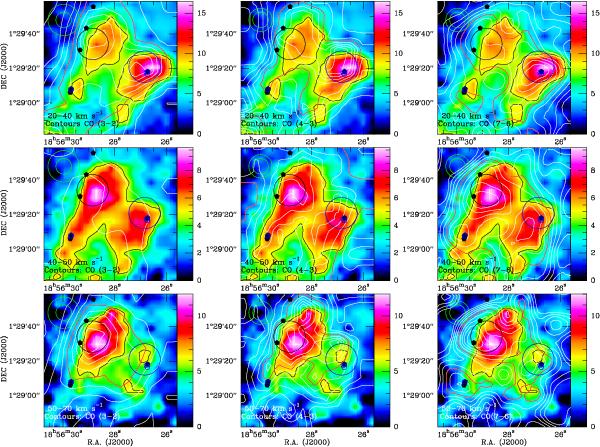
Overlays of the velocity-integrated maps of CO (3–2) (left
column), CO (4–3) (middle column), and CO (7–6)
(right column) as white contours on the CO (6–5) emission (colour
background) observed towards W44E with the APEX telescope. The maps are in their
original resolution (9  for CO (6–5), 13
 for CO (4–3), and 18
 for CO (3–2)), except for CO
(7–6), which was smoothed to the resolution of CO (4–3) in order to improve the
signal-to-noise. The intensity was integrated between 20–40 km s-1 (blue wing, top row),
40–50 km s-1
(ambient emission, middle row), and 50–70 km s-1 (red wing, bottom row).
The wedge unit is K km s-1 in antenna temperature. The contours are in steps
of 10%. The half-maximum contours of the colour and contour maps are indicated in
red and black, respectively. The blue and black circles indicate the positions of
our shock modelling analysis. The APEX beam sizes of the observations displayed are
given in the upper left corner of each map. The black and blue hexagons mark the
positions of the OH masers observed by Claussen et
al. (1997) and Hoffman et al.
(2005). At the assumed distance of 3 kpc the 9
beam of CO (6–5) corresponds to
a spatial resolution of 0.13 pc.
for CO (3–2)), except for CO
(7–6), which was smoothed to the resolution of CO (4–3) in order to improve the
signal-to-noise. The intensity was integrated between 20–40 km s-1 (blue wing, top row),
40–50 km s-1
(ambient emission, middle row), and 50–70 km s-1 (red wing, bottom row).
The wedge unit is K km s-1 in antenna temperature. The contours are in steps
of 10%. The half-maximum contours of the colour and contour maps are indicated in
red and black, respectively. The blue and black circles indicate the positions of
our shock modelling analysis. The APEX beam sizes of the observations displayed are
given in the upper left corner of each map. The black and blue hexagons mark the
positions of the OH masers observed by Claussen et
al. (1997) and Hoffman et al.
(2005). At the assumed distance of 3 kpc the 9
beam of CO (6–5) corresponds to
a spatial resolution of 0.13 pc.
Current usage metrics show cumulative count of Article Views (full-text article views including HTML views, PDF and ePub downloads, according to the available data) and Abstracts Views on Vision4Press platform.
Data correspond to usage on the plateform after 2015. The current usage metrics is available 48-96 hours after online publication and is updated daily on week days.
Initial download of the metrics may take a while.