Fig. 1
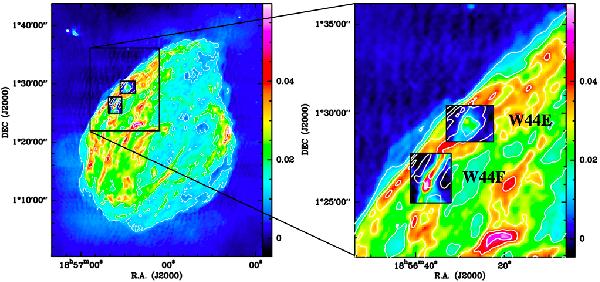
Location of the fields covered by our CO observations on the larger-scale radio continuum image at 1442.5 MHz, taken from Giacani et al. (1997). The wedges indicate the intensity of the continuum in Jy/beam. Left panel: entire SNR, right panel: zoom in the regions W44E and W44F. The inserts show the distribution of the CO (6–5) emission, integrated between 20 km s-1 and 70 km s-1, for which the colourscale is in the range 0–50 K km s-1, and the contours are radio continuum in steps of 10 mJy. The size of the zoombox is ~10.3 × 12.4 pc.
Current usage metrics show cumulative count of Article Views (full-text article views including HTML views, PDF and ePub downloads, according to the available data) and Abstracts Views on Vision4Press platform.
Data correspond to usage on the plateform after 2015. The current usage metrics is available 48-96 hours after online publication and is updated daily on week days.
Initial download of the metrics may take a while.