| Issue |
A&A
Volume 569, September 2014
|
|
|---|---|---|
| Article Number | A97 | |
| Number of page(s) | 13 | |
| Section | Extragalactic astronomy | |
| DOI | https://doi.org/10.1051/0004-6361/201323025 | |
| Published online | 30 September 2014 | |
A census of Hα emitters in the intergalactic medium of the NGC 2865 system⋆
1
European Southern Observatory, Karl-Schwarzschild-Strasse 2, 85748
Garching, Germany
2
Instituto de Astronomia, Geofì-sica e Ciências Atmosféricas,
Universidade de São Paulo, Rua do Matão 1226, Cidade Universitària,
05508–900
São Paulo, SP, Brazil
e-mail:
This email address is being protected from spambots. You need JavaScript enabled to view it.
3
Max-Planck-Institut für Extraterrestrische Physik,
Giessenbachstrasse,
85741
Garching,
Germany
4
Departamento de Física, Universidad de La Serena,
Av. Cisternas 1200 Norte,
La Serena,
Chile
5
Gemini Observatory/AURA, Southern Operations Center, Casilla 603
La Serena,
Chile
6
Physics Department, The Catholic University of
America, Washington,
DC
20064,
USA
7
Observational Cosmology Laboratory, Code 665, Goddard Space Flight Center,
Greenbelt, MD
20771,
USA
Received:
11
November
2013
Accepted:
5
June
2014
Abstract
Tidal debris, which are rich in HI gas and formed in interacting and merging systems, are suitable laboratories to study star formation outside galaxies. Recently, several such systems were observed, which contained many young star forming regions outside the galaxies. In previous works, we have studied young star forming regions outside galaxies in different systems with optical and/or gaseous tidal debris, in order to understand how often they occur and in which type of environments. In this paper, we searched for star forming regions around the galaxy NGC 2865, a shell galaxy that is circled by a ring of HI with a total mass of 1.2 × 10⁹ M⊙. Using the multi-slit imaging spectroscopy technique with the Gemini telescope, we detected all Hα emitting sources in the surroundings of the galaxy NGC 2865, down to a flux limit of 10-18 erg cm-2 s-1 Å-1. With the spectra information and the near and far-ultraviolet flux, we characterize the star formation rates, masses, ages, and metallicities for these HII regions. In total, we found 26 emission-line sources in a 60 × 60 Kpc field centered over the southeastern tail of the HI gas present around the galaxy NGC 2865. Out of the 26 Hα emitters, 19 are in the satellite galaxy FGCE 0745, and seven are intergalactic HII regions scattered over the south tail of the HI gas around NGC 2865. We found that the intergalactic HII regions are young (<200 Myr) with stellar masses in the range 4 × 10³ M⊙ to 17 × 106 M⊙. These are found in a region of low HI gas density, where the probability of forming stars is expected to be low. For one of the intergalactic HII regions, we estimated a solar oxygen abundance of 12 + log(O/H) ~ 8.7. We also were able to estimate the metallicity for the satellite galaxy FGCE 0745 to be 12 + log(O/H) ~ 8.0. Given these physical parameters, the intergalactic HII regions are consistent with young star forming regions (or clusters), which are born in situ outside the NGC 2865 galaxy from a pre-enriched gas removed from the host galaxies in a merger event. The relevance of these observations is discussed.
Key words: ISM: abundances / HII regions / galaxies: individual: NGC 2865 / galaxies: dwarf / galaxies: ISM / galaxies: star formation
Based on observations obtained at the Gemini Observatory, which is operated by the Association of Universities for Research in Astronomy, Inc., under a cooperative agreement with the NSF on behalf of the Gemini partnership: the National Science Foundation (United States), the Science and Technology Facilities Council (United Kingdom), the National Research Council (Canada), CONICYT (Chile), the Australian Research Council (Australia), Ministério da Ciência e Tecnologia (Brazil) and Ministerio de Ciencia, Tecnología e Innovación Productiva (Argentina) - Observing runs: GS-2008A-Q-35.
© ESO, 2014
1. Introduction
Stars are formed in dense regions inside giant molecular clouds. However, what triggers and quenches the cloud collapse is still an open question that has strong implications for the understanding of how galaxies form and evolve. One approach to this problem is the study of star formation in extreme environments. One of these environments is the tidal debris of HI gas caused by galaxy-galaxy interactions and galaxy mergers. They are excellent candidates to contain a large number of HII regions outside galaxies, as illustrated by the numerical simulations of Bournaud et al. (2008). With the detections of these intergalactic systems, we can analyze the probability to form stellar systems in environments where the gas density, HI ~ 1019 cm-2, is very low. In recent years, various authors reported intergalactic objects in interacting systems with gas tails, such as tidal dwarf galaxies (e.g., Duc & Mirabel 1998; Duc et al. 2000; Mendes de Oliveira et al. 2001; Hibbard et al. 2001; de Mello et al. 2012; Lee-Waddell et al. 2012) and intergalactic HII regions (e.g., Gerhard et al. 2002; Ryan-Weber et al. 2004; Mendes de Oliveira et al. 2004; Arrigoni Battaia et al. 2012; Torres-Flores et al. 2012; de Mello et al. 2012; Yagi et al. 2013).
When one or more gas rich galaxies are involved in an interaction, it is common to find extended tails of HI gas outside these galaxies. Galaxy interactions are rare phenomena in the local Universe, and even rarer if the interaction involves two massive galaxies, also know as a major merger. While these represent some of the most spectacular collisions we observe, they are far from being common. Because of the shape of the galaxy luminosity function, which rises at fainter luminosities, encounters more commonly involve a bright galaxy interacting with a small satellite. The optical Hubble Space Telescope (HST) Deep Sky Survey shows that the number of galaxies with signatures of interaction increase by approximately 10% between redshift 0.7 and 1 (e.g., Le Fèvre et al. 2000; López-Sanjuan et al. 2013) as compared to the Local Universe. One of the environmental effects triggered by galaxy interactions is extended star formation. This is commonly observed in pairs or in close interacting galaxies, mainly in the systems, which contain disturbed HI features. Recently, many efforts have been devoted to several systems in the local universe to understand the physical conditions that lead to the formation of new stars and to determine whether these are responsible for polluting the intergalactic medium with metal-enriched gas (e.g., Mendes de Oliveira et al. 2004); Ryan-Weber et al. (2004); Bournaud et al. (2004); de Mello et al. (2012); Torres-Flores et al. (2012); Arrigoni Battaia et al. (2012); Yagi et al. (2013). These are important points, given that many studies (i.e., Songaila 2001; Pettini et al. 2003; Becker et al. 2006); Ryan-Weber et al. (2006, 2009); Simcoe et al. (2011); Díaz et al. (2011); D’Odorico et al. (2013) showed that the intergalactic medium at a redshift of at least 6 is not a pristine remnant of the Big Bang, but rather it contains significant quantities of metals.
In this paper, we study the surroundings of the elliptical galaxy NGC 2865, which has an unusual quantity of HI gas around it (MHI ~ 1.2 × 10⁹ M⊙, Schiminovich et al. 1995). The galaxy NGC 2865 is classified as an E3 in the RC3 catalog (de Vaucouleurs et al. 1991), and it satisfies the Faber & Jackson (1976) relation (Lake & Dressler 1986). However, deep images of NGC 2865 demonstrate that it is a genuinely peculiar galaxy. The galaxy clearly shows a significantly disturbed morphology. Malin & Carter (1983) cataloged NGC 2865 as a shell galaxy: an external shell at about 2′ east of the nucleus is barely visible in both the NUV and in the HST ACS image. A faint loop is visible to the northwest of the galaxy, while a tail extension can be seen to the southeast (Rampazzo et al. 2007). These two features are typically associated with galaxy interactions. Stellar spectroscopy and UBV photometry set lower and upper limits to the age of the possible encounter to 1 and 4 Gyr respectively, which is consistent with major merger models (Schiminovich et al. 1995). This encounter would have lead to the formation of NGC 2865. Stellar spectroscopy of the nuclear regions of NGC 2865 (Bica & Alloin 1987) shows a bump in the spectrum at 4600 Å and a corresponding strengthening of the Balmer lines, which are features that may correspond to an intermediate-age burst of star formation. In addition, NGC 2865 presents an unusual ring of HI gas around it, which may be a remnant of a merger event. The galaxy NGC 2865 has no nearby companions of similar luminosity; only two gas-rich galaxies are seen nearby, FGCE 0745 and [M98k] 092035.0-225654, at 6′ and 9′ from NGC 2865, which are at 1.0 and 1.5 kpc, respectively. Basic physical parameters for NGC 2865 and the nearest galaxy FGCE 0745 are listed in Table 1; M98k has not been observed in this work. Other authors studying similar systems (considering the morphological types of the galaxies) are Boselli et al. (2005) for the interacting pairs M 86/NGC 4438 and Arrigoni Battaia et al. (2012) for the system VCC1249/M49, where several intergalactic HII regions were discovered.
In this article, we address the question whether star formation is possible in low-density HI gas and if the HI gas around NGC 2865 is primordial. If the gas is not primordial, it must be removed from a gas-rich galaxy by a tidal effect during an interaction and actually is in the intergalactic medium.
The layout of this paper is as follows. In Sect. 2, the novel observational technique and the data reduction are described. Data analysis is shown in Sect. 3. In Sect. 4, the principal properties and the results for each HII region are presented. This is followed by a discussion in Sect. 5 and the conclusion in Sect. 6. Throughout the paper, we assume ΩM = 0.3, ΩΛ = 0.7, and H0 = 100 h km s-1 Mpc-1 with h = 0.75.
Principal parameters for NGC 2865 and the satellite galaxy FGCE 0745 from the literature.
2. Observations
2.1. Spectroscopic observations
The data were collected with the Gemini Multi-Object Spectrograph (Hook et al. 2004, hereafter GMOS) mounted on the Gemini South telescope in Chile in queue mode (Program ID. GS-2008A-Q-35).
The southeastern HI tail of NGC 2865 (α(2000) = 9h23m
37  13,
13,
 ) was imaged with the r′ filter on
2008 Jan. 28 (UT) in clear conditions and with an average seeing of 0.95′′. The images were processed in
the standard manner with the Gemini iraf package (version 1.8). The final
combined images were used to build the multi-slit mask.
) was imaged with the r′ filter on
2008 Jan. 28 (UT) in clear conditions and with an average seeing of 0.95′′. The images were processed in
the standard manner with the Gemini iraf package (version 1.8). The final
combined images were used to build the multi-slit mask.
A technique called multi-slit imaging spectroscopy (MSIS) has been used to search for HII regions in the gaseous tail of NGC 2865. The use of the MSIS technique requires the construction of a special mask with multiple long slits spaced by a few arcsecs combined with a narrow-band filter. We built a mask with multiple parallel long slits of 1′′ in width and spaced every 8′′. Figure 1 shows the combined r′ image with the mask overlaid onto it.
The spectra were observed on 2008 Apr. 13 (UT) during dark time through thin cirrus and with a seeing that varied between 0.̋6 and 0.̋8. The mask was observed in nine different positions with each one shifted spatially by 1′′with respect to the previous one, which is always in the same direction. The dither pattern used covered ~95% of the field inside the 5′ × 5′ GMOS field of view. At each position (nine in total), 3 × 315 s exposures were obtained with the 400 lines mm-1 ruling a density grating (R400), centered at 6620 Å and using the Hα continuum filter1. Internal flats were obtained every 3 science exposures, and CuAr (copper-argon) arc lamp calibration frames were acquired at the beginning and the end of the observing sequence. In addition, the CuAr arc lamp was observed without the Hα continuum filter at the end of the observing sequence. The selected instrument setup (grating + narrow band filter + central wavelength) has been chosen to optimize the detection of any Hα emissions for all emitting objects at the rest frame of the NGC 2865 galaxy down to a flux of 10-18 ergs cm-2 Å-1. At the redshift of the galaxy, the Hα lines are expected to be around 6620 Å. The log of the observations is given in Table 2.
All spectra were bias subtracted, trimmed, flat-fielded, and wavelength calibrated using the Gemini iraf package version 1.8. To calibrate the spectra in wavelength, we first used the CuAr lamp observed without the Hα continuum filter to identify the lines belonging to the wavelength region covered by our observations (6590 Å−6660 Å) and to asses the errors associated to the wavelength calibration. We used the argon lines at 6604 Å and 6643 Å, which are the two strongest lines visible, to calibrate the spectra. Using the CuAr lamp observed without the Hα continuum filter, the residual values in the wavelength solution for 70–77 points using a fourth-order Chebyshev polynomial typically yielded rms values of ~0.8 Å. Finally, the spectra were flux calibrated using the spectrophotometric standard star LTT 9239. The final spectra have a wavelength coverage between ~6590 Å and ~6660 Å (~70 Å), an instrumental resolution of ~9 Å at 6620 Å, and a dispersion of ~1.5 Å/pixel.
Observation logbook.
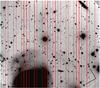 |
Fig. 1 Mask overlaid onto the r′-band pre-imaging of 5.5′ × 5.5′. The slits are arranged in a total of 108 long slits with two short interruptions for mechanical stability of the mask. The width of each slit is 1 arcsec. This position mask is for POS0. |
2.1.1. The advantages of the MSIS technique
The MSIS is a novel technique, which is very efficient at searching for faint HII regions compared to standard narrow band imaging. The MSIS technique has been successfully used to detect planetary nebulae (e.g., Gerhard et al. 2005, 2007; Arnaboldi et al. 2007; Ventimiglia et al. 2011). This is the first time that this technique is applied to carry out a survey of HII regions in the external regions of a galaxy. Unlike previous studies (e.g., Mendes de Oliveira et al. 2004; Ryan-Weber et al. 2004; de Mello et al. 2012; Lee-Waddell et al. 2012), the MSIS is a blind technique that is capable of finding all the Hα emissions in a field of view of a few arcminutes squared down to a certain flux limit in the Hα line of 10-18 erg cm-2 s-1 Å-1. Thus, we are able to do a complete census of HII regions in the surveyed field. In narrow band imaging, detections are sky limited by the sky noise from 100 Å, which is typically the FWHM of Hα narrow band filter. In the MSIS, the noise from the sky comes from a few Å only, depending on the slit width and seeing. Thus, fluxes that are of order 10 times fainter can be detected.
Intergalactic HII regions candidates in the environment of NGC 2865.
2.1.2. Hα candidates
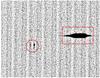 |
Fig. 2 Two-dimensional spectra of emission objects in the Gemini Field, position 4. The spatial direction goes along the y-axis. The wavelength goes along the horizontal axis (6580−6670 Å); the spectral resolution is 9 Å, or 411 km s-1. Each vertical stripe represent a spectrum of 68 Å wide. The circle marks the region IG_04_P4 with a flux of 3.2 × 10⁻¹⁶ erg s-1 cm-2. The rectangle shows the spectrum of a background galaxy with continuum. |
At each mask position, the average MSIS frames were inspected for the presence of emission line objects. Here, we found three kinds of emission line objects:
-
Emission line objects that are resolved/unresolved in both wavelength and space with high equivalent widths, which are the HII region candidates. We consider a source to be resolved in wavelength if the full width at half maximum (FWHM) of the lines in its spectrum is larger than the FWHM measured for the typical ARC lamp line. A source is spatially resolved if the FWHM in the y-direction is larger than the seeing.
-
Continuum sources with line emission. These are spectra from the satellite galaxy FGCE 0745, with an average radial velocity of ~2878 km s-1.
-
Continuum sources without line emission. These spectra are background galaxies or field stars.
A section of the average MSIS two-dimensional spectrum for the mask position 4 (POS4) is shown in Fig. 2. Each vertical stripe in Fig. 2 represents a spectrum ~70 Å wide. The spatial direction is along the y-axis, while the wavelength direction for each of the ~70 Å-wide spectra is along the horizontal x-axis. In Fig. 2, we provide examples for different emission sources detected in these 2D spectra. A typical HII emitter is indicated the region marked with a red circle, while a background galaxy is marked with a red rectangle. Each spectrum found in the images is wavelength calibrated and distortion corrected using the Gemini package (gemini.gmos.gswavelength and gemini.gmos.gstransform). Then, 1D spectra are extracted, and finally, the velocities are measured via a Gaussian fit using the position of the redshifted Hα (6563 Å) emission line for all the HII regions candidates (task rv.rvidlines). The standard deviation estimated for the velocity of each region was estimated using Monte Carlo simulations, and with the error in the wavelength calibration, we obtain a final error for the velocities of ~40 km s-1.
Using the MSIS technique, we detected 36 emission-line objects in the 2D images. Doing an inspection of the 1D spectra for the detected emission lines, we only considered 26 of them based on their signal-to-noise ratio (S/N). Emissions with ratio S/N ≤ 10 were discarded. We note that emission lines of all our intergalactic region candidates are unresolved in wavelength.
Computing α and δ (J2000) for the emission line candidates. For a given 2D spectrum, we have the pre-imaging with the position of each slit of the mask. Thus, for each one of the emission line objects, we measured the coordinate (x,y)em (in the spectral plane), which was then transformed to (x,y)im coordinates in the pre-imaging. With the position (x,y)im, we transformed the coordinate of each emission line to the corresponding world coordinate system WCS α, δ (J2000). In Table 3, we list the α and δ, the central wavelength (λc), the full width half maximum (FWHM), the systemic velocity and the flux for the Hα line for the HII regions candidates. The same parameters are listed in Table 4 for the emitters in the satellite galaxy FGCE 0745.
In this work, we did not find extended sources with low surface brightness. For such spatially extended sources, the MSIS technique detects emissions in more than one slit position along the x-axis in the mask or as an extended emission along the y-axis. Such emission, if present, would be visible in the sky spectrum, which is obtained by extracting spectra from all the slits along the same column. None of the sky spectra showed emission at the redshifted wavelength of the Hα emission. Note that Hα emissions were detected in several slits only for one source, (IG_04): this source is clearly a bright extended HII region with several substructures parts and not a low surface brightness source.
2.2. HI gas
Schiminovich et al. (1995) obtained neutral hydrogen maps of the system NGC 2865 with the Very Large Array (VLA, beam 73″ × 40″). The HI cloud is distributed in a discontinuous ring around the galaxy NGC 2865 with a total mass of 1.2 ± 0.6 × 10⁹ M⊙. It is rotating around NGC 2865 with a circular velocity ~250 km s-1. The HI ring around NGC 2865 extends for ~110 kpc of diameter (north and south HI tails) and it has a width of ~45 kpc. Assuming that the gas is rotating in a circular orbit centered on the nucleus, the estimated inclination is 65°. Schiminovich et al. (1995) indicated that the main body of NGC 2865 and the gas ring might have formed from the same event, and this can be explained by a major merger of nearly equal mass progenitors. Schiminovich et al. using stellar spectroscopy and UBV photometry determined the merger to be between 1 and 4 Gyr ago. These estimates are consistent with those found by Fort et al. (1986) for low surface brightness structures in NGC 2865. If the HI gas clumps are orbiting in a stable circular orbit, the upper limit for the age of the merger corresponds to eight orbits of the gas around NGC 2865. Schiminovich et al. (1995) also detected the presence of a gas-rich satellite galaxy, FGCE 0745, located 6′ to the southeast of NGC 2865. It is an edge-on spiral galaxy containing 4.4 × 10⁸ M⊙ of HI.
Hα emissions from the satellite galaxy FGCE 0745.
2.3. Ultraviolet data
We used GALEX far- and near-ultraviolet (FUV and NUV) background-subtracted images from the MultiMission Archive at the Space Telescope Science Institute (MAST). The exposure times were 2560 s and 16250 s for FUV and NUV, respectively. The fluxes were measured using the task PHOT in iraf. The aperture used is optimized to the size of the region in the NUV image. In cases where the detection was not spatially resolved, we assume that the aperture, define as the point spread function (PSF) of GALEX (5′′ FWHM), is centered on the coordinates of Hα emission. The FUV and NUV magnitudes were calculated using Morrissey et al. (2005)mλ = 2.5log [ Fλ/aλ ] + bλ, where aNUV = 2.06 × 10⁻¹⁶ erg s-1 cm-2 Å-1, aFUV = 1.4 × 10⁻¹⁵ erg s-1 cm-2 Å-1, bNUV = 20.08, and bFUV = 18.82, inside an aperture, which depended on the size of the source given by the Hα line. Fluxes are multiplied by the effective filter bandpass (ΔλFUV = 269 Å and ΔλNUV = 616 Å) to give units of erg s-1 cm-2. The magnitudes in FUV and NUV were corrected for foreground Galactic extinction using E(B − V) = 0.0716 and AFUV = E(B − V) × 8.29, and ANUV = E(B − V) × 8.18 (Seibert et al. 2005).
3. Analysis
For each object, we derived the following parameters; 1) stellar mass; 2) ionizing photon luminosity; 3) total mass of ionized hydrogen; 4) age and 5) metallicity, when possible. In this section, we explain how these quantities are computed.
To obtain the main physical parameters for each region, we derived the Hα luminosity (LHα = 4πD2FHα) by considering a distance of 35.0 Mpc, a distance estimated by Georgakakis et al. (2001) for the galaxy NGC 2865 (assuming Ho = 75 km s-1 Mpc-1). From LHα, we derived the principal parameters using the equations below.
The star formation rate (SFR): one of the main unknowns
in the study of star formation in young clusters is the value of the intrinsic dust
absorption. Since there are no infrared data available for these regions and the
Hβ line is
not observed, we were not able to estimate the internal extinction, thus only a lower limit
to the total SFR is estimated. We used the equation given by Kennicutt (1998) to estimate the SFR for all regions, assuming a “continuous star
formation” approximation. In such a case, we use LHα as the sum
of the luminosities of all sources. Considering all HII regions together, we estimated a
lower limit of the total SFR for the ensemble as follows:
![Mathematical equation: \begin{eqnarray} \textit{SFR}_{{\rm H}_{\alpha}} ({\rm M}_\odot~{\rm yr}^{-1}) = \frac{L_{{\rm H}_{\alpha}}}{1.26 \times 10^{41}} \; \; \; \; \; \; \; \; \; \; \; \; \; \;[{\rm L}_{{\rm H}{\alpha}} ~~\text{in}~ ~{\rm erg}~ {\rm s}^{-1}]. \end{eqnarray}](/articles/aa/full_html/2014/09/aa23025-13/aa23025-13-eq93.png) (1)With
the purpose of estimating the total mass of ionized hydrogen, we computed the
ionizing photon luminosity, Q(H°), given by Osterbrock & Ferland (2006):
(1)With
the purpose of estimating the total mass of ionized hydrogen, we computed the
ionizing photon luminosity, Q(H°), given by Osterbrock & Ferland (2006):
![Mathematical equation: \begin{eqnarray} Q(H^\circ) (\text{photon} {\rm s}^{-1}) = 7.31\times10^{11} L_{{\rm H}\alpha} \; \; \; \; \; \; \; [{\rm L}_{{\rm H}{\alpha}}~~ \text{in}~~ {\rm erg}~ {\rm s}^{-1}]. \end{eqnarray}](/articles/aa/full_html/2014/09/aa23025-13/aa23025-13-eq95.png) (2)The
total mass of ionized hydrogen (MHII): this is estimated as suggested by
Osterbrock & Ferland (2006):
(2)The
total mass of ionized hydrogen (MHII): this is estimated as suggested by
Osterbrock & Ferland (2006):
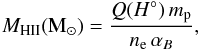 (3)where
ne
and mp denote the electron density and proton
mass. We consider ne
= 400 cm-3, which are typical values of the electron density for
brighter regions in 30 Dor (Osterbrock & Ferland
2006) and the recombination coefficient αB = 2.59 ×
10-13 cm-3 s-1.
(3)where
ne
and mp denote the electron density and proton
mass. We consider ne
= 400 cm-3, which are typical values of the electron density for
brighter regions in 30 Dor (Osterbrock & Ferland
2006) and the recombination coefficient αB = 2.59 ×
10-13 cm-3 s-1.
Tables 5 and 6 list the physical parameters described above using the Hα line of the intergalactic HII region candidates and the star forming regions in the satellite galaxy FGCE 0745.
Physical parameters derived from the Hα line for the intergalactic HII regions.
Physical parameters derived from the Hα line, for the satellite galaxy FGCE 0745.
3.1. UV emitting regions
Whenever possible, we estimated the luminosity in the FUV- and NUV-bands for each HII source (assuming that the distance to the main galaxy NGC 2865 is D = 35 Mpc). With the emission in UV and considering an instantaneous burst, we estimated a lower limit for the age and the mass for each intergalactic HII region. We note that we used a different assumption from the one used for the estimate of the SFRs. To estimate ages and masses, we are treating each region individually and we assume instantaneous burst. For the regions IG_17_P1 and IG_51_P3, we did not detect emission coming from the FUV-band. Therefore, for these two regions, we were not able to estimate ages and masses.
Age estimates – For the five regions with detected UV-emission, a lower limit to their age comes from the color FUV-NUV and the models given by starburst99 (SB99; Leitherer et al. 1999). These models are generated for an instantaneous burst, solar metallicity, and Salpeter initial mass function (IMF; 0.1−100 M⊙), and they are optimized for GALEX filter transmission curves. We remark that we did not correct the UV-magnitudes for the internal reddening, therefore our estimates are only lower limits to the age of the star forming event. We note that Boquien et al. (2007) adopt a method based on both NUV and Hα emissions to estimate the ages for the intergalactic HII regions. However, this estimator is not applicable in our case because the aperture used to measure the emission in ultraviolet and optical was different: the FWHM for the GALEX images is typically ≃5′′and the Hα emission was measured from a spectrum within an aperture of 1′′)˙.
Stellar mass estimates – We used the obtained ages and the FUV luminosities to estimate the stellar masses with SB99 models. These values were obtained from the SB99 monochromatic luminosity, L1530, for an instantaneous burst, Salpeter IMF (from 0.1 to 100 M⊙), and solar metallicity for stellar masses between 103 to 108 M⊙. With the age obtained by the color FUV-NUV, we fixed the luminosity in 1530 Å, given by SB99 for the different mass, and using the intrinsic luminosity of each object, we interpolated the respective mass. Since we used ultraviolet fluxes for the computations, older generations of stars were not taken into consideration in the stellar mass determination.
3.2. Metallicity
We calculated the metallicity, when possible, using the empirical method N2, as proposed and calibrated by Pettini & Pagel (2004). This “empirical” method is adequate for estimating oxygen abundances in extragalactic HII regions. The method considers the N2 index (N2 ≡ log{[NII] λ6583/Hα }) and the relation 12 + log (O / H) = 8.90 + 0.57 × N2 to estimate the oxygen abundance. The uncertainties on the calibration of this method are 0.18 dex when 68% of the points are included. The same method was used in de Mello et al. (2012) for tidal dwarf galaxies and intergalactic HII regions, and they found a close agreement in the oxygen abundance derived from the O3N22 and N2 method.
4. Results
Using the MSIS technique, we carried out a flux limited survey of the Hα emitters over the
southeastern HI tail around NGC 2865, down to a flux limit of 10-18 erg cm-2 s-1 Å-1. We consider a field of view of
5′× 5′centered at α(J2000) 09h23m 37 13 and
δ(J2000)
− 23° 11′ 54.̋34. We found 26 spectra with
ratio S/N>
10. Seven of them are emission sources in the intergalactic medium around
NGC 2865, and nineteen are regions associated with the satellite galaxy FGCE 0745.
Each source is identified with a label, either by IG or Sat_slit_mask, depending on whether such emission is found in the intergalactic medium around NGC 2865 or if it is associated with the satellite galaxy. Here, mask is the number of the mask position where the source was found, and slit is the slit number for a given position of the mask. In some cases for the same slit, we detected two emissions at adjacent offset positions: in such cases, we add a number (1 or 2) next to the slit number.
4.1. Intergalactic HII regions
Seven sources were found in the intergalactic region around NGC 2865. In Fig. 3, we plot the seven intergalactic Hα emissions on the NUV image. In Fig. 4 we show the GALEX NUV and r′-Gemini counterparts at the position of the detected Hα emission; blue circle indicates the GALEX NUV and the red circle the r′-Gemini. Circles have the same sizes as the apertures used in the photometry. The size of each image is 0.35′ × 0.41′. The 2D and the extracted spectra for six of the seven regions are plotted in Fig. 5. The Hα line is marked in each case. We also mark the position where the emission line [NII]λ6583 is expected. For one of the seven regions, IG_04, we detect emission at three different positions of the mask (POS0, POS3, and POS4). In Fig. 6, we show these three spectra with dashed lines and their sum with a solid line. The Hα and [NII] lines are also marked.
We note that we rule out the possibility that these regions are background Lyα emitters. We compared the flux obtained in each detected line with the flux estimate for a Lyα emitter at z = 4 (considering that the Lyα line is at λ1215 Å which are observed at λ6620 Å). We used the result from Gronwall et al. (2007) for a survey of Lyα at z = 3.1, where the mean flux obtained for this sample was 2.9 × 10⁻¹⁷ erg s-1 cm-2. Using the cosmology calculator (Wright 2006) we extrapolated the mean flux from Gronwall et al. for emitters at z = 4. Their estimated flux is then 1.5 × 10⁻¹⁷ erg s-1 cm-2, while the flux of our detected sources is an order of magnitude brighter at a mean flux of 1.8 × 10⁻¹⁶ erg s-1 cm-2. Given this argument, we then conclude that all emissions detected in our work are from the Hα line.
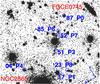 |
Fig. 3 GALEX-NUV image in a field of view of 5.5′× 5.5′. The seven extragalactic Hα sources are indicated by blue labels; red labels indicate the galaxies NGC 2865 and FGCE 0745. |
We now describe each intergalactic region in turn:
Region IG_04 – In the Gemini r′-band of Fig. 4, the region is resolved into subcomponents: a stellar cluster and a tail. The size of the region in the Gemini image was 3.̋9 (714 pc) without considering the tail. This region appears to be similar to the two regions found in HGC100 by de Mello et al. (2012). The Hα emission from region IG_04 was observed at three different positions of the mask, POS0, POS3, and POS4 (IG_04_P0, IG_04_P3 and IG_04_P4). At each position, the Hα line appears with good ratio S/N ≃ 30. When we combined the 1D spectra using the task scombine in iraf and with the “sum” option in the combine operation, it is possible to detect and measure the fluxes of the [NII] line (λ = 6583 Å, ratio S/N≃ 15) and the [NII] line (λ = 6548 Å, ratio S/N ~ 10). The detection of these three lines confirm that IG_04 is an intragroup HII region and not a background object. Despite the low ratio S/N of the [NII]λ6548 line, we measured the relative fluxes between [NII] lines. We estimated that the [NII]λ6548/[NII]λ6583 ratio is ≃3.3, which is within the errors, if we consider the predicted model ration of 3 (Osterbrock & Ferland 2006). Thus, we are able to estimate the oxygen abundance. The N2 index is − 0.3, which are 12 + log (O / H) = 8.7, indicating solar metallicity (Asplund et al. 2009). For the region IG_04, we highlight that we found two different velocities for the three mask positions. For the positions POS0 and POS4, we measured a velocity of ~2630 ± 40 km s-1, but the velocity was 2811 ± 40 km s-1 for the position POS3, which is different by ~200 km s-1. This may suggest that we are observing two different sources.
Region IG_87_P0 – For the UV and r′-band images, we used an aperture of radius 5.̋5 to obtain the principal physical parameters of this region. In the Hα line, this region has the highest ratio S/N of the seven intergalactic HII regions, ratio S/N ≃ 48. The strong emission in Hα, optical, and UV-bands can imply that two different scenarios could be happening: 1) it could be an early-type galaxy at high redshift that emits a strong emission line, which is not Hα; 2) the region has three different stellar populations: one contains older stars (optical emission), a new generation of stars which emit in the UV, with an age of approximately 200 Myr (estimated in Sect. 3.1) with a very young population at ~10 Myr, which emits in the Hα line. We note that this object is at least 2 mag brighter than any of the other six regions studied here, and its morphology resembles that of a galaxy, which would indicate that it is not an HII region-like object. However, a spectrum covering a greater range of wavelengths is necessary to confirm the nature of this region.
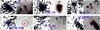 |
Fig. 4 Six of the seven intergalactic regions in GALEX-NUV and Gemini-r bands, indicated by the blue and red circles, respectively. The radius of each circle indicates the aperture used in the photometry for each source. The size of each image is 21′′× 25′′. |
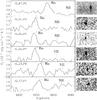 |
Fig. 5 Emission lines from detected intergalactic HII region candidates: 1D (left) and 2D (right). The Hα line and the place where it is expected to find the [NII] line are marked. |
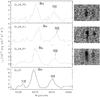 |
Fig. 6 Emission lines of the region IG_04: 1D (left) and 2D (right). The position of the Hα and [NII] lines are marked. |
Region IG_51_P3 – This object is not detected in FUV while there is a faint emission, which blended with an extended source in the North in NUV. In the r′-image, the emission is spatially resolved and appears like a small cluster. One possible explanation for the absence of the FUV emission is a possibly large amount of dust present in the region. Since the source is not resolved, we considered a radius of 2.̋5 , given by the resolution of GALEX (FWHM ≃ 5″).
Region IG_85_P6 – The emission line, Hα, has a ratio S/N ≃ 13. This source is resolved in both FUV- and NUV-bands and presents a faint extended emission in the optical r′-band image. For the photometry, we used a radius of 4.̋5, given the size of the source in the UV images. We estimated a lower limit to the age of about 16 Myr and a mass of 9 × 10⁴ M⊙, which is typical of a young cluster.
Region IG_52_P7 – This region presents a faint extended emission in UV bands and a very diffuse emission in the r′-band. Although it is an unresolved source, we estimated the flux from the UV in a radius of 2.̋5 (given by the resolution of GALEX), which is centered on the position of the Hα line.
Region IG_23_P8 – In GALEX images, the UV-emission is blended with an extended galaxy emission near to the source. In r′-band, it is possible to resolve two sources, a galaxy and a nearby small emission, which could be the responsible for the detected Hα line. For the photometry of this unresolved region, we used a radius of 2.̋5, which is centered on the Hα emission.
Region IG_17_P1 – The spectrum of this region contains a weak Hα line with a ratio S/N ~11. It is not observed in either FUV or the r′-band emission. In the NUV and FUV images, one can see that the source clearly overlaps the position of a bright foreground star (see Fig. 3 for the NUV image), which prevents us from classifying this region as a young and low-mass region.
All these regions are located in low-density of HI gas (HI ≥ 1019 cm-2, Schiminovich et al. 1995), where the probability of forming stars is low, in general (Maybhate et al. 2007).
When we compare the ages derived for the several regions above, we note that they can be as large as 50 to 200 Myr, while our selection was based on Hα, which is known to be present in systems with ages smaller than about 10 Myr. This could seem like a contradiction but it is not. The first argument is that the FUV-NUV flux comes from an extended 5′′ region, which is larger than the region emitting in Hα and is unresolved on the MSIS images. The second argument is that extinction may play a role, and given that we only have one color, we cannot correct for extinction. The third and last argument is that the FUV-NUV probes an older population than the one causing emission in Hα. That is, we detect the FUV and NUV continuum from stars that have an age <200 Myr (from SB99), which also contains a subpopulation that is only a few Myr old and emits in Hα. In other words, what we are seeing in the UV is a combination of young and massive stars (also seeing in Hα) and more evolved stars formed earlier. We note that the UV luminosities found for these HII regions are larger than those expected from the recent star forming population giving rise to the measured Hα flux. From Fig. 9 in Pflamm-Altenburg et al. (2009), we estimate the expected FUV luminosity associated with the star forming episode associated with the measured Hα luminosity of 5 × 1037 erg s-1. The expected FUV luminosity is 2 × 1025 erg s-1, which is nearly 10 times lower than the measured FUV fluxes for these sources.
In Fig. 7, we show the intergalactic Hα emitter regions, which are found in this work, superposed onto the HI contours and Gemini r′-band (HI contours taken from Schiminovich et al. 1995).
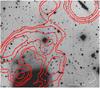 |
Fig. 7 HI contours from Schiminovich et al. (1995). The gas is shown as red contours on an optical r′-band from Gemini. The HII region candidates are indicated by the blue circles. The Gemini image only considers the south tidal debris of the system. This figure shows that the HII sources are detected along the ring of HI contours. The contour levels are 1.9, 3.8, 7.6, and 11.4 × 1019 cm-2. The VLA beam is 73″ × 40″. |
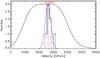 |
Fig. 8 Line-of-sight velocities vLOS of the Hα emitters with the Ha_C filter used for the MSIS observations. The red line indicates the systemic velocity of NGC 2865 (2627 km s-1, Smith et al. 2000). The distribution of the velocity of the seven intergalactic HII regions has a peak at 2711 km s-1, which is very close to the systematic velocity of NGC 2865. The Gaussian distribution is plotted in blue has average velocity 2627 km s-1 and σ = 200 km s-1. |
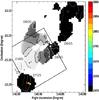 |
Fig. 9 LOS velocities of the HII regions discovered in the current survey and HI velocity field taken from Schiminovic et al. (1995, Fig. 1d). The cross at the center of the ring indicates the position of the galaxy NGC 2865. The color code refers to the LOS velocity. The velocity gradient along the major axis of FGCE 0745 is clearly visible and ranges from 2781 km s-1 to 3063 km s-1. The field of view surveyed with the MSIS technique is 5′ × 5′ and is shown by the black rectangle. |
4.2. Are the intergalactic HII regions bound to NGC 2865?
We now discuss the observational evidence in support of these systems to be gravitationally bound to the central galaxy NGC 2865. Using the Hα emission line and the task noao.onedspec.rv.rvidlines within iraf, we measured the line-of-sight (LOS) velocities for each HII region. In Fig. 8, we plot the histogram of their VLOS with the filter Ha_C bandpass used in the observation. The systemic velocity of NGC 2865 (2627 km s-1, Smith et al. 2000) is indicated with a red line, and it is very close to the peak of the distribution of the LOS velocities of the intergalactic HII regions. The average velocity of the seven HII regions is 2711 km s-1, which is only 84 km s-1 redder than the systemic velocity of NGC 2865. Our seven intergalactic HII regions also have LOS velocities that are similar to those of the HI gas at the same location (velocity of the gas from 2405 to 2645 km s-1); hence, this supports an association between these HII emitters and the HI tail. In Fig. 9, the Hα sources are overplotted on the velocity field of the HI gas. The velocity range in the HI tail is also consistent with the Gaussian distribution with an average velocity =2627 km s-1 and σ = 200 km s-1: hence, the kinematic of the HI tail is consistent with that of on orbit gravitationally bound to the central galaxy NGC 2865.
If the seven HII regions are at equilibrium, the velocity dispersion obtained from the
standard deviation of their LOS velocities is 184 km s-1. This value is similar to the
central velocity dispersion measured by Hau et al.
(1999) for NGC 2865, σ0 = 200 km s-1. In Fig. 8, we plot a Gaussian distribution with σ = 200 km s-1 and an average velocity
 km s-1, which turns out to be a good
approximation for the histogram distribution of the LOS of the seven HII regions.
km s-1, which turns out to be a good
approximation for the histogram distribution of the LOS of the seven HII regions.
The result of the comparison between the histogram of the HII vLOS and the Gaussian distribution is consistent with the hypothesis that these intergalactic HII regions are bound to NGC 2865.
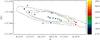 |
Fig. 10 Velocity field for the satellite galaxy FGCE 0745. The dots are the Hα detections in the galaxy and the different colors represent different velocities (km s-1) listed on the bar on the right side of the figure. The contour levels are 22.3, 22.2 and 22.1 mag/arcsec2 from the Gemini r′-band. |
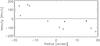 |
Fig. 11 Rotation curve for the satellite galaxy FGCE 0745. Excluding the three measurements indicated by asterisks, the rotation curve is very similar to those of late-type galaxies. We infer a Vmax ≃ 160 km s-1. |
4.3. Star forming regions in the satellite galaxy FGCE 0745
The object FGCE 0745 is an edge-on galaxy located ≃6′ to the southeast of NGC 2865 (see Fig. 3). As shown in Fig. 7, the HI gas distribution of this galaxy is relatively undisturbed with no evidence of on-going interaction with NGC 2865. This does not exclude that these two galaxies have not interacted in the past, given that the velocity of the HI gas of FGCE 0745 is similar to the velocity of the HI ring around NGC 2865.
Using the MSIS technique, we found nineteen Hα sources within the satellite galaxy FGCE 0745.
The spectra of these nineteen sources are shown in Fig. A.1. The coordinates, velocity and Hα fluxes for each source are listed in Table 4. The optical emission of the galaxy is at the same
location as the peaks in HI gas and the Hα emission shown in Fig. 7 and 10. Using the LOS velocity
of each detected Hα source, we derive a velocity map for FGCE 0745. In
Fig. 10, this map is shown and the contours
represent the optical emission of the galaxy, taken from the r′-band. We note
that most of the Hα sources were detected along the photometric major
axis of the galaxy. Assuming circular orbits (considering the angular inclination as
 ), we
determine the rotation curve (Fig. 11) using an
inclination of 80°,
a position angle of 70°, the systemic velocity 2920 km s-1, and the kinematic center of
FGCE 0745 to be at α(J2000) 9h23m41 85
δ(J2000)
− 23°14′47.̋97. The rotation curve is
derived taking into account those pixels within a cone of 30° aligned with the galaxy’s major
axis. Excluding the three points in asterisks that do not follow the circular pattern
defined by the remaining points, Fig. 11 shows a
rotation curve, which is consistent with those of late type galaxies, and a total
ΔVrot =
320 kms-1. Assuming that the Hα emission is detected all
over the galaxy disk, we estimated Vmax = 160 kms-1. A radius of 26′′ (≃4.2 kpc) was derived from the optical image
(r′-band). A similar value for the radius
of this galaxy is given in NED3. Assuming a
spherical mass distribution for this galaxy, we estimated a total mass of Mdyn = 2.5 ×
1010 M⊙ by considering the
gravitational constant given by G = 4.3 × 10⁻⁹ km2 s-2 Mpc
), we
determine the rotation curve (Fig. 11) using an
inclination of 80°,
a position angle of 70°, the systemic velocity 2920 km s-1, and the kinematic center of
FGCE 0745 to be at α(J2000) 9h23m41 85
δ(J2000)
− 23°14′47.̋97. The rotation curve is
derived taking into account those pixels within a cone of 30° aligned with the galaxy’s major
axis. Excluding the three points in asterisks that do not follow the circular pattern
defined by the remaining points, Fig. 11 shows a
rotation curve, which is consistent with those of late type galaxies, and a total
ΔVrot =
320 kms-1. Assuming that the Hα emission is detected all
over the galaxy disk, we estimated Vmax = 160 kms-1. A radius of 26′′ (≃4.2 kpc) was derived from the optical image
(r′-band). A similar value for the radius
of this galaxy is given in NED3. Assuming a
spherical mass distribution for this galaxy, we estimated a total mass of Mdyn = 2.5 ×
1010 M⊙ by considering the
gravitational constant given by G = 4.3 × 10⁻⁹ km2 s-2 Mpc
 (Mo et al. 2010).
In Fig. 12, we show the co-added spectrum from the nineteen Hα detections, which is shifted at the rest wavelength. The Hα and the [NII]λ6583 lines are observed, although the fainter line of the [NII] doublet at 6548 Å is not detected. Using the empirical method N2, we estimated a metallicity of 12 + log (O / H) = 8.0.
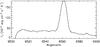 |
Fig. 12 Co-added spectrum for the nineteen Hα emissions detected in FGCE 0745. |
Physical parameters derived from GALEX FUV and NUV images.
5. Discussion
Rings of neutral hydrogen around the galaxies are not very common in the nearby universe. The mechanism, which is able to produce such rings, is still not clear. One of the most famous systems is Leo’s Hi ring, which has a diameter ~200 kpc, a MHII~109 M⊙ (Schneider 1989), and a density from 2 × 10¹⁸ to 6.4×10¹⁹ (Schneider et al. 1989) that is quite asymmetric and somewhat clumpy. This system is similar to the HI ring around NGC 2865 but differs in the central galaxies. While the Leo ring circles two galaxies, a spherical elliptical M 105, and a S0 galaxy NGC 3384 with no strong disturbances (Michel-Dansac et al. 2010), NGC 2865 is a shell galaxy. Another system with similar characteristics is described by Bettoni et al. (2010), who found an extended outer ring of atomic gas around the lenticular galaxy NGC 4262. For both these systems, faint UV sources are detected in association with the HI rings and a low SFR is estimated, ~10-3 M⊙ yr-1 (Thilker et al. 2009; Bettoni et al. 2010,Leo’s and NGC 4262, respectively).
5.1. Intergalactic HII regions
In this work, we found seven intergalactic HII regions around the galaxy NGC 2865 at the same positions of HI debries of low density. The ages of the stellar populations associated with these emissions are young (<200 Myr) and with masses no larger than 17 × 106 M⊙. Given these masses and ages, all regions found in this work are considered as young star forming regions (or clusters). Our results agree with previous work by Knierman et al. (2003), who found that structures formed in tidal tails (optical and HI) may manifest themselves as either clusters along the tail or larger systems, such as dwarf galaxies but not in both. Note, however, that the HII regions found in our work belong to tidal tails seen in HI and not in optical. Gerhard et al. (2002) also detected an HII region in a low density HI debris in the Virgo cluster with an upper limit to the density of 1 × 1019 cm-2 (Oosterloo & van Gorkom 2005). Recently, Yagi et al. (2013) identified four star forming systems in the tail of NGC 4388 in the Virgo cluster. Other authors reporting similar results are Mendes de Oliveira et al. (2004), who reported spectroscopic confirmation of four intergalactic Hii region in the HCG92, and Ryan-Weber et al. (2004), who found four isolated HII regions in two systems, NGC 1533 and HCG 16. All these regions are located in low density of HI ~ 1019−20 cm-2, which is similar to that found in this work.
The HII regions with similar masses and ages were found by Torres-Flores et al. (2012) for the system NGC 2782 and de Mello et al. (2012) for HCG 92. Interestingly, these regions are within HI density contours, but they are not superposed with any HI peaks. This is different from the case of tidal dwarf galaxies (TDGs), which are expected to be found at the location of HI peaks, like HCG 100 (de Mello et al. 2012). Hence, it seems that the formation of TDGs is not favored in the environment around NGC 2865 because of the absence of significant over-densities in the HI distribution.
The very faint continuum emission of the seven intergalactic HII regions, similarly to other star clusters found in interacting systems, suggests that these stellar populations are the first to be formed, and there were only very few stars or none previously. More data on these star clusters, especially in the near infrared to constraint intrinsic absorption, are necessary to confirm this.
5.2. Metallicity
The metallicity of the elliptical galaxy NGC 2865 is nearly solar (Hau et al. 1999), which is comparable with the metallicity of galaxies whose morphological types are earlier than Sc. If NGC 2865 is a merger remnant of two disk spirals, then there might be some pre-enriched gas around this system, which was dispersed in the intracluster medium during such an event.
If such pre-enriched material exists, then the young star forming regions that form out of it would not follow the correlation between luminosity and metallicity for classical dwarf galaxies (Skillman et al. 1989). They would have a luminosity that corresponds to local star formation and a relative high metallicity inherited from their progenitor galaxies. The break in the correlation between luminosity and metallicity is a diagnostic to separate “classical” dwarf galaxies and young star clusters formed in galaxy interactions. Hence, the measurements of the metallicity of the young star forming regions around NGC 2865 can provide the evidence for pre-enriched gas.
Indeed, the presence of such pre-enriched gas is supported by the value for the metallicity measured for the intergalactic HII region IG_04 of about 12 + log (O / H) = 8.7 ± 0.18, which is very near to the solar value. Detections of young star forming regions with solar metallicity is not uncommon: about ten star-forming regions are reported in the literature. For example, Duc et al. (2000) measured one such region in Arp 245; Mendes de Oliveira et al. (2004) measured four star forming regions with a metallicity near solar in the compact group HCG 92; Michel-Dansac et al. (2010) found one region in the Leo Ring; de Mello et al. (2012) detected two regions in HCG 100; Torres-Flores et al. (2012) measured seven regions in NGC 2782. Recently Yagi et al. (2013) also detected four regions in the Virgo cluster. The detection of young star forming regions with a metallicity (12 + log(O/H)) larger than 8.3 indicate that merger events may be responsible for enriching the intergalactic medium with metals by dispersing pre-enriched gas from the progenitor galaxies, which is also observed in the galaxy NGC 92 by Torres-Flores et al. (2014). The young ages estimated for all the HII regions around NGC 2865 may indicate that they formed in situ and from pre-enriched gas.
The comparison between the metallicity of IG_04 and FGCE 0745 (12 + log(O/H) = 8.7 and 8.0, respectively) indicates that the gas out of which the stars are forming in IG_04 has a different origin from that in the satellite galaxy. Rather, its origin is most likely linked to NGC 2865 or the progenitor galaxies which merged to form NGC 2865. Additional deeper spectroscopic follow-up for the remaining six regions is required to detect the [NII] lines independently and also confirm the presence of pre-enriched gas in these star-forming regions.
5.3. The satellite galaxy FGCE 0745
With the MSIS technique, we measured the Hα emissions in the satellite galaxy FGCE 0745 in addition to those emissions coming from the intergalactic HII regions. We identify nineteen Hα emitters in this galaxy. From the observed wavelength of the Hα lines, we measured the heliocentric LOS velocities in the range from 2747 to 3086 km s-1, and a systemic velocity for the galaxy center of 2920 km s-1. From the HI gas, Schiminovich et al. (1995) reports that the systemic velocity of FGCE 0745 is ~2725 km s-1, which is somewhat bluer by ≃200 km s-1 than our estimated velocity.
We are also able to derive a velocity field and the rotation curve, which are shown in Fig. 10 and 11. Assuming circular orbits for the ionized gas and the centrifugal equilibrium, we estimated a total mass of 2.5 × 10¹⁰ M⊙. From the Tully-Fisher relation (Torres-Flores et al. 2011) and Vmax ~ 160 km s-1, we estimated an approximate stellar mass of 1.2 × 10¹⁰ M⊙ and a total baryonic mass (including the HI gas) of 1.4 × 10¹⁰.
From the total Hα luminosity, we estimated a lower limit to the total SFR of 2.3 × 10⁻² M⊙ yr-1: this value is consistent with those measured in a few low mass galaxies in compact groups (Bitsakis et al. 2011).
6. Conclusions
With the multi-slit imaging spectroscopy (MSIS) technique and the Gemini telescope, we perform a flux limited Hα survey in a 5′ × 5′ field center on the southern part of the HI ring that circles the elliptical galaxy NGC 2865. We detect nineteen Hα emissions within the satellite galaxy FGCE 0745 and seven intergalactic Hα emitters on the southern part of the HI ring. The line-of-sight velocities of the Hα emissions are consistent with the systemic velocity and central velocity dispersion of NGC 2865 and the satellite galaxy FGCE 0745.
Using the Hα fluxes, we derive a constant star SFR of 2.6 × 10⁻³ M⊙ yr-1 for the entire sample of intergalactic HII regions. Such a low SFR is consistent with star formation occurring in a very low HI density environment.
We measured GALEX FUV and NUV fluxes for five out of the seven intergalactic HII regions around NGC 2865. The color of these sources are consistent with a wide range of ages (<200 My) and masses (1.7 × 10⁷–5.0 × 10³ M⊙). The young ages and the low masses suggest that these star clusters were formed in situ out of gaseous debris at those locations.
We are also able to estimate the metal abundance of one intergalactic HII region, IG_04, to be 12 + log(O/H) = 8.7, which is similar to the value determined for NGC 2865. Such metallicity value is higher that the one expected for a dwarf galaxy of similar luminosity as the intracluster region IG_04.
We also detect the Hα emissions associated with the satellite galaxy FGCE 0745. We identify nineteen sources along the galaxy major axis and determine a maximum rotation velocity of Vmax ≃ 160 km s-1. By co-adding the spectra from the HII emission in FGCE 0745, we are able to measure the [NII]λ6548 line and derive the metallicity for this satellite galaxy, which is lower than solar.
The comparison between the metallicity for the gas in the satellite galaxy and that for the intergalactic region IG_04 indicate that the gas in IG_04 has a different origin, which most likely comes from gaseous debris dispersed in the intracluster regions by the merging event that led to the formation of NGC 2865.
Deeper spectroscopy of the intergalactic sources and the NGC 2865 galaxy are required to further explore and determine the internal extinction of these star forming regions and place stronger constraints on their ages and metal content.
O3N2 ≡ log{([OIII]λ5007/Hβ)/([NII]λ6583/Hα) }.
Without reference.
Acknowledgments
The authors would like to thank the anonymous referee for the thoughtful comments which improved the clarity of this paper. We would like to thank C.D.P. Lagos, L. Coccato and A. Longobardi for help and useful discussions. This work is based on observation obtained with the Gemini telescope. This work has made used of NED-database, Mikulski Archive for Space Telescope (MAST). F.U.-V. acknowledges the financial support of ESO studentship programme and CNPq through a Ph.D. CMdO thanks FAPESP for funding through thematic grant 2006/56213-9. S.T.-F. acknowledges the financial support of the Chilean agency FONDECYT through a project “Iniciación en la Investigación”, under contract 11121505 and S.T.-F. also acknowledges the support of the project CONICYT PAI/ACADEMIA 7912010004. DFdM was partially funded by NASA ADAP NNX09AC72G.
References
- Arnaboldi, M., Gerhard, O., Okamura, S., et al. 2007, PASJ, 59, 419 [NASA ADS] [Google Scholar]
- Arrigoni Battaia, F., Gavazzi, G., Fumagalli, M., et al. 2012, A&A, 543, A112 [NASA ADS] [CrossRef] [EDP Sciences] [Google Scholar]
- Asplund, M., Grevesse, N., Sauval, A. J., & Scott, P. 2009, ARA&A, 47, 481 [NASA ADS] [CrossRef] [Google Scholar]
- Becker, G. D., Sargent, W. L. W., Rauch, M., & Simcoe, R. A. 2006, ApJ, 640, 69 [NASA ADS] [CrossRef] [Google Scholar]
- Bettoni, D., Buson, L. M., & Galletta, G. 2010, A&A, 519, A72 [NASA ADS] [CrossRef] [EDP Sciences] [Google Scholar]
- Bica, E., & Alloin, D. 1987, A&AS, 70, 281 [NASA ADS] [Google Scholar]
- Bitsakis, T., Charmandaris, V., da Cunha, E., et al. 2011, A&A, 533, A142 [NASA ADS] [CrossRef] [EDP Sciences] [Google Scholar]
- Boquien, M., Duc, P.-A., Braine, J., et al. 2007, A&A, 467, 93 [NASA ADS] [CrossRef] [EDP Sciences] [Google Scholar]
- Boselli, A., Boissier, S., Cortese, L., et al. 2005, ApJ, 623, L13 [NASA ADS] [CrossRef] [Google Scholar]
- Bournaud, F., Duc, P.-A., Amram, P., Combes, F., & Gach, J.-L. 2004, A&A, 425, 813 [NASA ADS] [CrossRef] [EDP Sciences] [Google Scholar]
- Bournaud, F., Duc, P.-A., & Emsellem, E. 2008, MNRAS, 389, L8 [NASA ADS] [CrossRef] [Google Scholar]
- de Mello, D. F., Urrutia-Viscarra, F., Mendes de Oliveira, C., et al. 2012, MNRAS, 426, 2441 [NASA ADS] [CrossRef] [Google Scholar]
- de Vaucouleurs, G., de Vaucouleurs, A., Corwin, Jr., H. G., et al. 1991, 3rd Reference Catalogue of Bright Galaxies. Volume I: Explanations and references. Volume II: Data for galaxies between 0h and 12h, Volume III: Data for galaxies between 12h and 24h [Google Scholar]
- Díaz, C. G., Ryan-Weber, E. V., Cooke, J., Pettini, M., & Madau, P. 2011, MNRAS, 418, 820 [NASA ADS] [CrossRef] [Google Scholar]
- D’Odorico, V., Cupani, G., Cristiani, S., et al. 2013, MNRAS, 435, 1198 [NASA ADS] [CrossRef] [Google Scholar]
- Duc, P.-A., & Mirabel, I. F. 1998, A&A, 333, 813 [NASA ADS] [Google Scholar]
- Duc, P.-A., Brinks, E., Springel, V., et al. 2000, AJ, 120, 1238 [NASA ADS] [CrossRef] [Google Scholar]
- Faber, S. M., & Jackson, R. E. 1976, ApJ, 204, 668 [NASA ADS] [CrossRef] [Google Scholar]
- Fort, B. P., Prieur, J.-L., Carter, D., Meatheringham, S. J., & Vigroux, L. 1986, ApJ, 306, 110 [NASA ADS] [CrossRef] [Google Scholar]
- Georgakakis, A., Hopkins, A. M., Caulton, A., et al. 2001, MNRAS, 326, 1431 [NASA ADS] [CrossRef] [Google Scholar]
- Gerhard, O., Arnaboldi, M., Freeman, K. C., & Okamura, S. 2002, ApJ, 580, L121 [NASA ADS] [CrossRef] [Google Scholar]
- Gerhard, O., Arnaboldi, M., Freeman, K. C., et al. 2005, ApJ, 621, L93 [NASA ADS] [CrossRef] [Google Scholar]
- Gerhard, O., Arnaboldi, M., Freeman, K. C., et al. 2007, A&A, 468, 815 [NASA ADS] [CrossRef] [EDP Sciences] [Google Scholar]
- Gronwall, C., Ciardullo, R., Hickey, T., et al. 2007, ApJ, 667, 79 [NASA ADS] [CrossRef] [Google Scholar]
- Hau, G. K. T., Carter, D., & Balcells, M. 1999, MNRAS, 306, 437 [NASA ADS] [CrossRef] [Google Scholar]
- Hibbard, J. E., van der Hulst, J. M., Barnes, J. E., & Rich, R. M. 2001, AJ, 122, 2969 [NASA ADS] [CrossRef] [Google Scholar]
- Kennicutt, Jr., R. C. 1998, ApJ, 498, 541 [NASA ADS] [CrossRef] [Google Scholar]
- Knierman, K. A., Gallagher, S. C., Charlton, J. C., et al. 2003, AJ, 126, 1227 [NASA ADS] [CrossRef] [Google Scholar]
- Lake, G., & Dressler, A. 1986, ApJ, 310, 605 [NASA ADS] [CrossRef] [Google Scholar]
- Le Fèvre, O., Abraham, R., Lilly, S. J., et al. 2000, MNRAS, 311, 565 [NASA ADS] [CrossRef] [Google Scholar]
- Lee-Waddell, K., Spekkens, K., Haynes, M. P., et al. 2012, MNRAS, 427, 2314 [NASA ADS] [CrossRef] [Google Scholar]
- Leitherer, C., Schaerer, D., Goldader, J. D., et al. 1999, ApJS, 123, 3 [NASA ADS] [CrossRef] [Google Scholar]
- López-Sanjuan, C., Le Fèvre, O., Tasca, L. A. M., et al. 2013, A&A, 553, A78 [NASA ADS] [CrossRef] [EDP Sciences] [Google Scholar]
- Malin, D. F., & Carter, D. 1983, ApJ, 274, 534 [NASA ADS] [CrossRef] [Google Scholar]
- Maybhate, A., Masiero, J., Hibbard, J. E., et al. 2007, MNRAS, 381, 59 [NASA ADS] [CrossRef] [Google Scholar]
- Mendes de Oliveira, C., Plana, H., Amram, P., Balkowski, C., & Bolte, M. 2001, AJ, 121, 2524 [NASA ADS] [CrossRef] [Google Scholar]
- Mendes de Oliveira, C., Cypriano, E. S., Sodré, Jr., L., & Balkowski, C. 2004, ApJ, 605, L17 [NASA ADS] [CrossRef] [Google Scholar]
- Michel-Dansac, L., Duc, P.-A., Bournaud, F., et al. 2010, ApJ, 717, L143 [Google Scholar]
- Mo, H., van den Bosch, F. C., & White, S. 2010, Galaxy Formation and Evolution (Cambridge: Cambridge University Press) [Google Scholar]
- Morrissey, P., Schiminovich, D., Barlow, T. A., et al. 2005, ApJ, 619, L7 [NASA ADS] [CrossRef] [Google Scholar]
- Oosterloo, T., & van Gorkom, J. 2005, A&A, 437, L19 [NASA ADS] [CrossRef] [EDP Sciences] [Google Scholar]
- Osterbrock, D. E., & Ferland, G. J. 2006, Astrophysics of gaseous nebulae and active galactic nuclei (Sausalito: University Science Books) [Google Scholar]
- Pettini, M., & Pagel, B. E. J. 2004, MNRAS, 348, L59 [NASA ADS] [CrossRef] [Google Scholar]
- Pettini, M., Madau, P., Bolte, M., et al. 2003, ApJ, 594, 695 [NASA ADS] [CrossRef] [Google Scholar]
- Pflamm-Altenburg, J., Weidner, C., & Kroupa, P. 2009, MNRAS, 395, 394 [NASA ADS] [CrossRef] [Google Scholar]
- Rampazzo, R., Marino, A., Tantalo, R., et al. 2007, MNRAS, 381, 245 [NASA ADS] [CrossRef] [Google Scholar]
- Ryan-Weber, E. V., Meurer, G. R., Freeman, K. C., et al. 2004, AJ, 127, 1431 [NASA ADS] [CrossRef] [Google Scholar]
- Ryan-Weber, E. V., Pettini, M., & Madau, P. 2006, MNRAS, 371, L78 [NASA ADS] [CrossRef] [Google Scholar]
- Ryan-Weber, E. V., Pettini, M., Madau, P., & Zych, B. J. 2009, MNRAS, 395, 1476 [NASA ADS] [CrossRef] [Google Scholar]
- Schiminovich, D., van Gorkom, J. H., van der Hulst, J. M., & Malin, D. F. 1995, ApJ, 444, L77 [Google Scholar]
- Schneider, S. E. 1989, ApJ, 343, 94 [NASA ADS] [CrossRef] [Google Scholar]
- Schneider, S. E., Skrutskie, M. F., Hacking, P. B., et al. 1989, AJ, 97, 666 [NASA ADS] [CrossRef] [Google Scholar]
- Seibert, M., Martin, D. C., Heckman, T. M., et al. 2005, ApJ, 619, L55 [NASA ADS] [CrossRef] [Google Scholar]
- Simcoe, R. A., Cooksey, K. L., Matejek, M., et al. 2011, ApJ, 743, 21 [NASA ADS] [CrossRef] [Google Scholar]
- Skillman, E. D., Kennicutt, R. C., & Hodge, P. W. 1989, ApJ, 347, 875 [NASA ADS] [CrossRef] [Google Scholar]
- Smith, R. J., Lucey, J. R., Hudson, M. J., Schlegel, D. J., & Davies, R. L. 2000, MNRAS, 313, 469 [NASA ADS] [CrossRef] [Google Scholar]
- Songaila, A. 2001, ApJ, 561, L153 [NASA ADS] [CrossRef] [Google Scholar]
- Thilker, D. A., Donovan, J., Schiminovich, D., et al. 2009, Nature, 457, 990 [NASA ADS] [CrossRef] [PubMed] [Google Scholar]
- Torres-Flores, S., Epinat, B., Amram, P., Plana, H., & Mendes de Oliveira, C. 2011, MNRAS, 416, 1936 [NASA ADS] [CrossRef] [Google Scholar]
- Torres-Flores, S., de Oliveira, C. M., de Mello, D. F., Scarano, S., & Urrutia-Viscarra, F. 2012, MNRAS, 421, 3612 [NASA ADS] [CrossRef] [Google Scholar]
- Torres-Flores, S., Scarano, S., Mendes de Oliveira, C., et al. 2014, MNRAS, 438, 1894 [NASA ADS] [CrossRef] [Google Scholar]
- Ventimiglia, G., Arnaboldi, M., & Gerhard, O. 2011, A&A, 528, A24 [NASA ADS] [CrossRef] [EDP Sciences] [Google Scholar]
- Wright, E. L. 2006, PASP, 118, 1711 [NASA ADS] [CrossRef] [Google Scholar]
- Yagi, M., Gu, L., Fujita, Y., et al. 2013, ApJ, 778, 91 [NASA ADS] [CrossRef] [Google Scholar]
Appendix A: Spectra FGCE07445
We present the spectra for the Hα sources inside the satellite galaxy FGCE 0745. In total, we found 19 Hα emitting regions, where the Hα line is clearly distinguishable for all of them. The identification of the regions are on the top-left of each panel. The principal parameters derived from the Hα line are in Tables 4 and 6.
 |
Fig. A.1 Spectra of the Hα emitter regions detected in the satellite galaxy FGCE 0745. |
All Tables
Principal parameters for NGC 2865 and the satellite galaxy FGCE 0745 from the literature.
Physical parameters derived from the Hα line, for the satellite galaxy FGCE 0745.
All Figures
|
Fig. 1 Mask overlaid onto the r′-band pre-imaging of 5.5′ × 5.5′. The slits are arranged in a total of 108 long slits with two short interruptions for mechanical stability of the mask. The width of each slit is 1 arcsec. This position mask is for POS0. |
| In the text | |
|
Fig. 2 Two-dimensional spectra of emission objects in the Gemini Field, position 4. The spatial direction goes along the y-axis. The wavelength goes along the horizontal axis (6580−6670 Å); the spectral resolution is 9 Å, or 411 km s-1. Each vertical stripe represent a spectrum of 68 Å wide. The circle marks the region IG_04_P4 with a flux of 3.2 × 10⁻¹⁶ erg s-1 cm-2. The rectangle shows the spectrum of a background galaxy with continuum. |
| In the text | |
|
Fig. 3 GALEX-NUV image in a field of view of 5.5′× 5.5′. The seven extragalactic Hα sources are indicated by blue labels; red labels indicate the galaxies NGC 2865 and FGCE 0745. |
| In the text | |
|
Fig. 4 Six of the seven intergalactic regions in GALEX-NUV and Gemini-r bands, indicated by the blue and red circles, respectively. The radius of each circle indicates the aperture used in the photometry for each source. The size of each image is 21′′× 25′′. |
| In the text | |
|
Fig. 5 Emission lines from detected intergalactic HII region candidates: 1D (left) and 2D (right). The Hα line and the place where it is expected to find the [NII] line are marked. |
| In the text | |
|
Fig. 6 Emission lines of the region IG_04: 1D (left) and 2D (right). The position of the Hα and [NII] lines are marked. |
| In the text | |
|
Fig. 7 HI contours from Schiminovich et al. (1995). The gas is shown as red contours on an optical r′-band from Gemini. The HII region candidates are indicated by the blue circles. The Gemini image only considers the south tidal debris of the system. This figure shows that the HII sources are detected along the ring of HI contours. The contour levels are 1.9, 3.8, 7.6, and 11.4 × 1019 cm-2. The VLA beam is 73″ × 40″. |
| In the text | |
|
Fig. 8 Line-of-sight velocities vLOS of the Hα emitters with the Ha_C filter used for the MSIS observations. The red line indicates the systemic velocity of NGC 2865 (2627 km s-1, Smith et al. 2000). The distribution of the velocity of the seven intergalactic HII regions has a peak at 2711 km s-1, which is very close to the systematic velocity of NGC 2865. The Gaussian distribution is plotted in blue has average velocity 2627 km s-1 and σ = 200 km s-1. |
| In the text | |
|
Fig. 9 LOS velocities of the HII regions discovered in the current survey and HI velocity field taken from Schiminovic et al. (1995, Fig. 1d). The cross at the center of the ring indicates the position of the galaxy NGC 2865. The color code refers to the LOS velocity. The velocity gradient along the major axis of FGCE 0745 is clearly visible and ranges from 2781 km s-1 to 3063 km s-1. The field of view surveyed with the MSIS technique is 5′ × 5′ and is shown by the black rectangle. |
| In the text | |
|
Fig. 10 Velocity field for the satellite galaxy FGCE 0745. The dots are the Hα detections in the galaxy and the different colors represent different velocities (km s-1) listed on the bar on the right side of the figure. The contour levels are 22.3, 22.2 and 22.1 mag/arcsec2 from the Gemini r′-band. |
| In the text | |
|
Fig. 11 Rotation curve for the satellite galaxy FGCE 0745. Excluding the three measurements indicated by asterisks, the rotation curve is very similar to those of late-type galaxies. We infer a Vmax ≃ 160 km s-1. |
| In the text | |
|
Fig. 12 Co-added spectrum for the nineteen Hα emissions detected in FGCE 0745. |
| In the text | |
|
Fig. A.1 Spectra of the Hα emitter regions detected in the satellite galaxy FGCE 0745. |
| In the text | |
Current usage metrics show cumulative count of Article Views (full-text article views including HTML views, PDF and ePub downloads, according to the available data) and Abstracts Views on Vision4Press platform.
Data correspond to usage on the plateform after 2015. The current usage metrics is available 48-96 hours after online publication and is updated daily on week days.
Initial download of the metrics may take a while.