Fig. 7
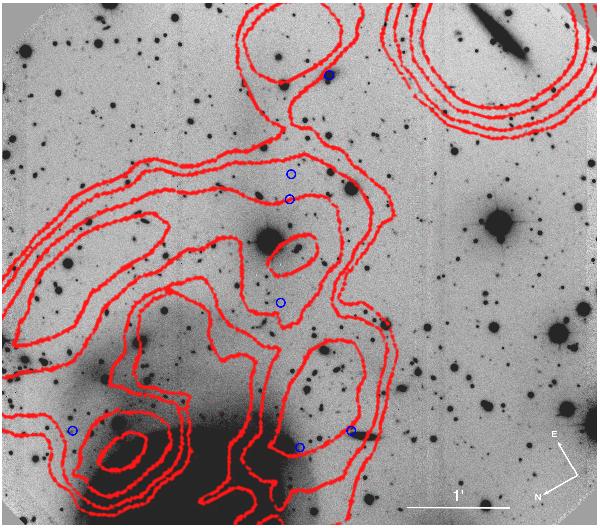
HI contours from Schiminovich et al. (1995). The gas is shown as red contours on an optical r′-band from Gemini. The HII region candidates are indicated by the blue circles. The Gemini image only considers the south tidal debris of the system. This figure shows that the HII sources are detected along the ring of HI contours. The contour levels are 1.9, 3.8, 7.6, and 11.4 × 1019 cm-2. The VLA beam is 73″ × 40″.
Current usage metrics show cumulative count of Article Views (full-text article views including HTML views, PDF and ePub downloads, according to the available data) and Abstracts Views on Vision4Press platform.
Data correspond to usage on the plateform after 2015. The current usage metrics is available 48-96 hours after online publication and is updated daily on week days.
Initial download of the metrics may take a while.