| Issue |
A&A
Volume 569, September 2014
|
|
|---|---|---|
| Article Number | A75 | |
| Number of page(s) | 7 | |
| Section | Cosmology (including clusters of galaxies) | |
| DOI | https://doi.org/10.1051/0004-6361/201322943 | |
| Published online | 26 September 2014 | |
Quadrant asymmetry in the angular distribution of cosmic microwave background in the Planck satellite data
1
Università di Roma “Tor Vergata”Dipartimento di Fisica,
00133
Rome,
Italy
e-mail:
This email address is being protected from spambots. You need JavaScript enabled to view it.
2
INFN, Sezione di Roma Tor Vergata, 00133
Rome,
Italy
3
Instituto Nacional de Pesquisas Espaciais - INPE,
Divisão de Astrofísica, 12227-010
São José dos Campos, SP, Brazil
Received: 29 October 2013
Accepted: 29 July 2014
Abstract
Some peculiar features found in the angular distribution of the cosmic microwave background (CMB) measured by the Wilkinson Microwave Anisotropy Probe (WMAP) deserve further investigation. Among these peculiar features is the quadrant asymmetry, which is likely related to the north-south asymmetry. In this paper, we aim to extend the analysis of the quadrant asymmetry in the ΛCDM framework to the Planck foreground-cleaned maps, using the mask provided by Planck team. We compute the two-point correlation function (TPCF) from each quadrant of the Planck CMB sky maps, and compare the result with 1000 Monte Carlo (MC) simulations generated assuming the ΛCDM best-fit power spectrum. We detect the presence of an excess of power in the southeastern quadrant (SEQ) and a significant lack of power in the northeastern quadrant (NEQ) in the Planck data. Asymmetries between the SEQ and the other three quadrants (southwestern quadrant (SWQ), northwestern quadrant (NWQ), and NEQ) are each in disagreement with an isotropic sky at a 95% confidence level. Furthermore, by rotating the Planck temperature sky map with respect to z direction, we showed the rotation angle where the TPCF of the SEQ has its maximal power. Our analysis of the Planck foreground-cleaned maps shows that there is an excess of power in the TPCF in the SEQ and a significant lack of power in the NEQ when compared with simulations. This asymmetry is anomalous when considering the ΛCDM framework.
Key words: cosmic background radiation / cosmology: observations / methods: statistical / methods: data analysis
© ESO, 2014
1. Introduction
The standard cosmological model, also known as Λ cold dark matter (ΛCMD) model, assumes homogeneous and isotropic expanding universe. At very early times, the universe, driven by a scalar field named inflaton, expanded rapidly. During this epoch, known as cosmological inflation, quantum fluctuations of the inflaton field were amplified to macroscopic scales, leading to the formation of primordial density perturbations, which then seeded the growth of cosmic structures. In this scenario, the perturbations are distributed as a homogeneous and isotropic Gaussian random field. At the epoch of decoupling between matter and radiation (z ~ 1000), primordial perturbations left an imprint in the cosmic microwave background (CMB) temperature as angular anisotropies. Deviations from statistical isotropy not related to foreground residuals or systematic effects can then point to interesting physical effects taking place in the early universe, and deserve further analysis.
The first report of anomalies in the CMB temperature angular distribution dates back to the Cosmic Background Explorer (COBE) data release (Smoot et al. 1992) when the amplitude of the quadrupole value was found to be smaller than what was expected according to the standard cosmological model. Later, the low quadrupole amplitude was confirmed using the Wilkinson Microwave Anisotropy Probe (WMAP) data (Bennett et al. 2003; Hinshaw et al. 2007, 2009; Jarosik et al. 2011). This result attracted much interest and resulted in further detailed statistical analysis of the CMB temperature angular distribution. Other unexpected features then emerged from the data, with examples including an alignment of the low order multipoles (Bielewicz et al. 2004; Schwarz et al. 2004; Copi et al. 2004; de Oliveira-Costa et al. 2004; Bielewicz et al. 2005; Land & Magueijo 2005; Copi et al. 2006; Abramo et al. 2006; Frommert & Ensslin 2010; Gruppuso & Burigana 2009), the cold spot, which corresponds to a region with a significant temperature decrement (Vielva et al. 2004; Cruz et al. 2005, 2007; Vielva 2010). More recently, the lack of large angle temperature correlations found previously on WMAP data were confirmed in Planck data by Copi et al. (2013).The anomaly more related to this paper are the north-south asymmetry (Eriksen et al. 2004a,b; Hansen et al. 2004a,b; Donoghue et al. 2005; Hoftuft et al. 2009; Paci et al. 2010; Pietrobon et al. 2010; Vielva et al. 2010) and the quadrant asymmetry (Santos et al. 2012).
A follower of COBE and WMAP, the Planck satellite is a mission designed to measure temperature and polarization anisotropies of the CMB, with unprecedented sensitivity and angular resolution. Planck data can be used to search for possible systematic errors in WMAP results. Some of the anomalies in the angular distribution of CMB temperature found in the WMAP data are already shown to be present in the Planck data (Planck Collaboration XXIII 2014) in opposition to the Bennett et al. (2013) claim that the anomalies are associated with systematics present in the data processing of WMAP first, third, fifth, and seventh year release. In addition, Bennett et al. (2011) found no statistical significance for the reported anomalies in the CMB temperature fluctuations found in WMAP data. It may then be interesting to repeat the statistical isotropy analysis done for WMAP, and previously for COBE, on Planck data.
The purpose of our study is to investigate the presence of quadrant asymmetry, which was detected in WMAP data by Santos et al. (2012), in the Planck data using the two-point angular correlation function (TPCF). This result showed the existence of an excess of power, at angular distances between pixels above 90 degrees, in the southeastern quadrant (SEQ). In Sect. 2, we present our method, which involves the generation of numerical simulations of the CMB sky to be compared with real data. In Sect. 3, we discuss the results of our investigation. Finally, in Sect. 4, we draw some conclusions.
2. Method
The dataset used for our analysis is the main Planck CMB temperature foreground cleaned map SMICA together with a confidence mask, i.e, the region outside which the foreground removal procedure is considered statistically robust. For comparison, we later used also the NILC and SEVEM maps. For a detailed description of the maps and the confidence masks see Planck Collaboration XII (2014). We obtain our main results by calculating the TPCF for four quadrants in the foreground-cleaned CMB temperature map. The TPCF is estimated as the average product between the temperature of all pairs of pixels in the masked map separated by an angular distance γ. It is then defined as:  (1)The temperature fluctuations of the pixels p and q are written as T(np) and T(nq), respectively.
The pixels p and q are defined by the coordinates (θp, φp) and (θq, φq), where 0° ≤ φ ≤ 360° and −90° ≤ θ ≤ 90°. The angular distance between two generic pixels is then:  (2)The TPCF derived from real data for each quadrant in the sky is then compared to the results for the simulated sky maps. In Galactic coordinates, we started our analysis by selecting the quadrants delimited by the Galactic plane and the plane perpendicular to the Galactic equator. We progressively rotate the map with respect to the z axis (south to north Galactic pole direction) from 0 to 5, 10, 30, and 60 degrees to determine possible changes in the TPCF power. Finally, we compare the results obtained with Planck data to the results previously obtained using WMAP data. We summarize our procedure in a few steps as described below:
-
We generated 1000 Monte Carlo (MC) simulations, with Nside = 256 (pixel size = 14′), using the Hierarchical Equal Area and Isolatitude Pixelization (HEALPix) package (Synfast) (Gorski et al. 2005) with the best-fit ΛCDM model power spectrum from Planck (Planck Collaboration I 2014) as an input.
-
We divided the Planck foreground-cleaned maps (SMICA, NILC, and SEVEM, taken from Planck Collaboration I 2014) and the simulated maps, expressed in Galactic coordinates, into quadrants:southeastern (SEQ), southwestern (SWQ), northeastern (NEQ) and northwestern (NWQ).
-
Even though the foreground-cleaned CMB maps reconstruct the CMB field over most of the sky, residual contamination in a stripe close to the Galactic plane is still present (Planck Collaboration XII 2014). Therefore, to ensure that our results are cosmological and not due to foreground contamination, we minimize the impact of the residual Galactic and point sources foregrounds by masking the contaminated pixels. We used the main confidence mask provided by the Planck team, which cuts 16.3% of the sky for Nside = 64. To see how sky cuts influence the TPCF read, Gruppuso (2013).
-
We removed the residual monopole and dipole from the maps using HEALPix packages (Anafast and Synfast).
-
We then calculate the TPCF for each quadrant of every map: since fluctuations at small angular scales are not relevant for our purposes, we degraded each simulated map as well as the used Planck maps and mask to Nside = 64 in order to speed up the analysis. In the last case, for the Nside = 64, a mask value equal to or smaller than 0.5 means that the pixel is rejected.
-
Finally, for each TPCF curve, we calculated a rms-like quantity, σ, defined as (Bernui et al. 2006):
 (3)where the fi corresponds to the TPCF for each bin i.
The number of pixels in each quadrant after the cut does not differ substantially, being 10 006, 10 600, 10 578, 9955 for the SEQ, SWQ, NEQ, and NWQ, respectively. We used a number of bins Nbins = 90 for our calculations, resulting in an angular distance between different samples of 2 degrees.
To quantify the statistical significance level of the asymmetry between quadrants in the Planck foreground-cleaned maps, we compare the observed σ values from Planck data with the mean σ values measured from the 1000 ΛCDM sky simulations for each quadrant. Finally, we search for the number of MC simulations with σ values higher or smaller than those found on the Planck temperature map for each quadrant. In this way, we are able to see if there is any excess or lack of power and if the temperature fluctuation of the quadrants are consistent with the ΛCDM model.
3. Results and discussion
Our analysis confirmed an excess of power in the SEQ Planck temperature data as shown in Fig. 1. The TPCF for this quadrant is outside the standard deviation for the TPCF found in the 1000 MC simulations for the best fit of the standard cosmological model. For the other quadrants, the curves corresponding to the data lay inside the MC standard deviation (Fig. 1).
For the sake of comparison, we also calculated the TPCF for the NILC and SEVEM maps, finding results consistent with the result using the main foreground-cleaned Planck map SMICA for each quadrant (see Fig. 2). As a summary, we show the TPCF for WMAP 7-year ILC map and SMICA using both Planck and WMAP masks for both maps in Fig. 3. We see that the results agree among each other as expected.
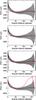 |
Fig. 1 TPCF curves computed for the main Planck temperature foreground-cleaned map (SMICA) (red curve) also using the mask provided by Planck team. We smoothed the curves using the smooth function from Interactive Data Language (IDL) for illustration purposes only (in the calculations we use the original calculated values for the TPCF). From top to bottom, NWQ, NEQ, SWQ, and SEQ appear as solid red lines. The shadow part depicts the standard deviation intervals (68% C.L) for 1000 simulated maps produced with the ΛCDM spectrum. The black curve is the mean TPCF considering the MC simulated maps. |
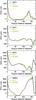 |
Fig. 2 Comparison between the Planck foreground-cleaned maps (SMICA, NILC and SEVEM). From top to bottom, the curves refer to the NWQ, NEQ, SWQ, and SEQ |
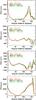 |
Fig. 3 Comparison between NWQ, NEQ, SWQ and SEQ (from top to bottom) for the TPCF using the WMAP KQ85 mask and the Planck mask for both maps: ILC WMAP7 and foreground-cleaned SMICA. |
We quantify the TPCF curves using the definition of Eq. (3). We found that, for the SEQ, 19.3% of the MC simulations present at least one quadrant with σ value equal to or higher than that value found in the SMICA Planck map. In the same manner, we found a lack of large-angle temperature correlation in the other quadrants considering the ΛCDM model. Comparing the SWQ σ values from the data with those obtained from simulations, we found 32.9% of the simulated maps with a quadrant having σ values equal to or smaller than that of the SMICA SWQ. In the northern quadrant, the lack of power in the data becomes even more evident, being σ smaller or equal to the value found in the data in 2.4% and 0.5% of the MC simulations for the NWQ and NEQ, respectively (see Table 2 and Fig. 4 for a summary of the results). The fact that the two point correlation function for the northern hemisphere is featureless relative to the southern hemisphere is in agreement with the results found in WMAP data (Eriksen et al. 2004a) and confirmed by analyzing Planck temperature maps (Planck Collaboration XXIII 2014).
Mean, 68.2%, 95%, and 99.7% C.L. values of the sigma ratios for different pair of quadrants using the simulated CMB maps considering the ΛCDM model.
Furthermore, it is important to compare the excess power found in the SEQ with the lack of power in the other quadrants, specially in the NEQ. Since the universe is expected to be isotropic, according to the standard cosmological model, we would not expect to find large deviations from 1 for σi/σj between i and j quadrants (i, j={SEQ, SWQ, NWQ, NEQ}). This result is confirmed by the mean found for the ratios between the σ values in each quadrant in the MC simulations, as we can see in Table 1 and Figs. 5 and 6, where we emphasize the SEQ with respect to the others since this quadrant has an excess of power in the real data. The mean values that slightly diverge from one1, for example the σSEQ/σNWQ, are due to the different number of pixels in each quadrant as a result of the use of the mask. In Table 1, we show the mean values of the rate between the quantity σ for each of the mentioned quadrants and its correspondent 68%, 95%, and 99.7% C.L. considering 1000 MC simulations.
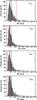 |
Fig. 4 Distribution of the σ values for each quadrant of the MC simulations. The black vertical line indicates where the mean value is located. The red line stands for the value found in SMICA + Planck mask. |
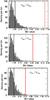 |
Fig. 5 Distribution of the σ ratio between pair of quadrants. The black vertical line indicates where the mean value lies in the Monte Carlo simulations. The red line stands for the value found in SMICA + Planck mask. |
The asymmetries found in the data are not present in 99% of the MC simulated maps considering exactly the same configuration as for the data, as can be seen in Tables 1 and 3 (probability P1) and Figs. 5 and 6. We calculated the probability that the values for σSEQ/σj, being (j = { SWQ,NWQ,NEQ }), in the simulated maps have equal to or higher values than those found in the Planck data. We found that 1%, 0.2%, and less than 0.1% of the simulations have the asymmetries presented in the SMICA map for σSEQ/σSWQ, σSEQ/σNWQ and σSEQ/σNEQ, respectively. As we can also see in Table 3, the largest asymmetry occurs between the SEQ and the NEQ, the same found by Santos et al. (2012) in WMAP data using the KQ85 mask. Taking into consideration that the occurrence of this asymmetry in the data (σSEQ/σNEQ) can happen between any quadrant in the simulated maps, regardless of the different number of pixels in each quadrant because of the use of the mask, we found a probability of 0.8% for this asymmetry to happen (see Table 3, probability P3). It is important to point out that Santos et al. (2012) found no evidence for a connection between the SEQ excess of power and the so-called cold spot anomaly (see Vielva et al. 2004; Cruz et al. 2005, 2007; Vielva 2010).
On the other hand, as expected, σi/σNEQ, σi/σNWQ and σi/σSWQ, in this case for (i = { SWQ,NWQ,NEQ }) are nearly 1 and well inside the MC 99.7% C.L. (see Table 4). In Table 4, we can also see once again that the results are in agreement when WMAP KQ85 or Planck masks are used in the analysis.
Finally, we rotated the CMB temperature map with respect to the z axis, both in clockwise and anti-clockwise directions, to quantify the angle where the TPCF from SEQ reaches its highest power. The result is shown in Fig. 7. We see that the TPCF reaches its highest value for the 5 degree clockwise rotation. Comparing the σ values for the SEQ 0 degree rotation and the SEQ 5 degree clockwise rotation, we found an increase of almost 3% in the last case. Gradually, the excess of power on the TPCF starts to decrease as we rotate the sky above 10 degrees, since we are mixing, in this way, the initial SEQ and SWQ, the last one showing no anomaly previously. The rotations in the anti-clockwise direction show a more evident dissipation of the excess of power as the rotation angle increases. By rotating the quadrant we were not able to identify a possible source of the excess of power in the SEQ.
Probabilities of finding in the MC simulations the σ value higher than the value found in Planck data for the SEQ and smaller than the values found for SWQ, NEQ, and NWQ in the Planck map.
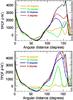 |
Fig. 7 Top: anti-clockwise rotation performed in the SEQ with respect to z direction for 60, 30, 10, and 5 degrees. Bottom: clockwise rotation performed in SEQ with respect to z direction for 60, 30, 10, and 5 degrees. In both plots, the black curve corresponds to a 0 degree rotation. |
Calculated probabilities of finding asymmetries equal to or higher than those found in Planck data in the MC simulations using both Planck and WMAP KQ85 mask considering the ΛCDM model.
4. Conclusion
We confirmed the existence of asymmetries between the SEQ and the other three quadrants, more evidently the NEQ, in the Planck CMB temperature map.The largest asymmetry, found between the SEQ and NEQ, is in disagreement with the assumption of statistical isotropy of the standard cosmological model above 95% C.L., considering that this asymmetry could happen between any quadrant in the simulated sky maps. The largest asymmetries occurs between the SEQ and the NEQ and NWQ. This result suggests that the excess power found earlier in the southern hemisphere corresponds to an excess power in the SEQ, since the asymmetries between the SWQ and the NEQ or NWQ, even though slightly larger than the asymmetry between the NEQ and the NWQ, are well inside the 99.7% C.L. We did not find, in 1000 simulated maps, all three asymmetries occurring simultaneously using the exactly same configuration of the Planck map quadrants. Finally, by performing rotations in the temperature map of 5, 10, 30, and 60 degrees with respect to the z direction in Galactic coordinates, we found that the 5 degree clockwise rotation corresponds to the configuration where the power in the SEQ reaches its maximum.
Further investigation is needed to explain the source of these asymmetries in the data. To date, a proper explanation is still missing in the literature.
Sigma ratios considering only SWQ, NWQ, and NEQ for Planck using both Planck and WMAP KQ85 mask.
It is important to point out that we used a different method from Santos et al. (2012), found more appropriate, to calculate the mean values of the σ ratios.
Acknowledgments
The authors acknowledge the use of HEALPix packages, of the Legacy Archive for Microwave Background Data Analysis (LAMBDA) and of the Planck Legacy Archive (PLA). The development of Planck has been supported by: ESA; CNES, and CNRS/INSU-IN2P3-INP (France); ASI, CNR, and INAF (Italy); NASA and DoE (USA); STFC and UKSA (UK); CSIC, MICINN, and JA (Spain); Tekes, AoF, and CSC (Finland); DLR and MPG (Germany); CSA (Canada); DTU Space (Denmark); SER/SSO (Switzerland); RCN (Norway); SFI (Ireland); FCT/MCTES (Portugal); and the development of Planck has been supported by: ESA; CNES, and CNRS/INSU-IN2P3-INP (France); ASI, CNR, and INAF (Italy); NASA and DoE (USA); STFC and UKSA (UK); CSIC, MICINN, and JA (Spain); Tekes, AoF, and CSC (Finland); DLR and MPG (Germany); CSA (Canada); DTU Space (Denmark); SER/SSO (Switzerland); RCN (Norway); SFI (Ireland); FCT/MCTES (Portugal); and PRACE (EU). A description of the Planck Collaboration and a list of its members, including the technical or scientific activities in which they have been involved, can be found at http://www.sciops.esa.int/index.php?project=planck&page=Planck_Collaboration. T. Villela acknowledges CNPq support through grant 308113/2010-1.
References
- Abramo, L. R., Bernui, A., Ferreira, I. S., et al. 2006, Phys. Rev. D, 74, 3506 [Google Scholar]
- Bennett, C. L., Halpern, M., Hinshaw, G., et al. 2003, ApJS, 148, 1 [NASA ADS] [CrossRef] [Google Scholar]
- Bennett, C. L., Hill, R. S., Hinshaw, G., et al. 2011, ApJS, 192, 17 [NASA ADS] [CrossRef] [Google Scholar]
- Bennett, C. L., Larson, D., Weiland, J. L., et al. 2013, ApJS, 208, 20 [Google Scholar]
- Bernui, A., Villela, T., Wuensche, C. A., et al. 2006, A&A, 454, 409 [NASA ADS] [CrossRef] [EDP Sciences] [Google Scholar]
- Bielewicz, P., Górski, K. M., & Banday, A. J. 2004, MNRAS, 355, 1283 [NASA ADS] [CrossRef] [Google Scholar]
- Bielewicz, P., Eriksen, H. K., Banday, A. J., et al. 2005, ApJ, 635, 750 [NASA ADS] [CrossRef] [Google Scholar]
- Copi, C. J., Huterer, D., Starkman, G. D. 2004, Phys. Rev. D, 70, 3515 [Google Scholar]
- Copi, C. J., Huterer, D., Schwarz, D. J., & Starkman, G. D. 2006, MNRAS, 367, 79 [NASA ADS] [CrossRef] [Google Scholar]
- Copi, C. J., Huterer, D., Schwarz, D. J., & Starkman G. D. 2013, MNRAS, submitted [arXiv:1310.3831] [Google Scholar]
- Cruz, M., Martínez-González, E., Vielva, P., & Cayón, L. 2005, MNRAS, 356, 29 [NASA ADS] [CrossRef] [Google Scholar]
- Cruz, M., Cayón, L., Martínez-González, E., et al. 2007, ApJ, 655, 11 [NASA ADS] [CrossRef] [Google Scholar]
- de Oliveira-Costa, A., Tegmark, M., Zaldarriaga, M., & Hamilton, A. 2004, Phys. Rev. D, 69, 063516 [NASA ADS] [CrossRef] [Google Scholar]
- Donoghue, E. P., & Donoghue, J.F., 2005, Phys. Rev. D, 71, 043002 [NASA ADS] [CrossRef] [MathSciNet] [Google Scholar]
- Eriksen, H. K., Hansen, F. K., Banday, A. J., et al. 2004a, ApJ, 605, 14 [NASA ADS] [CrossRef] [Google Scholar]
- Eriksen, H. K., Novikov, D. I., Lilje, P. B., et al. 2004b, ApJ, 612, 64 [NASA ADS] [CrossRef] [Google Scholar]
- Frommert, M., & Ensslin, T.A., 2010, MNRAS, 403, 1739 [NASA ADS] [CrossRef] [Google Scholar]
- Gorski, K. M., Hivon, E., Banday, A. J., et al. 2005, ApJ, 622, 759 [NASA ADS] [CrossRef] [Google Scholar]
- Gruppuso, A., & Burigana, C., 2009, JCAP, 8, 4 [Google Scholar]
- Gruppuso, A. 2013, MNRAS, accepted [arXiv:1310.2822] [Google Scholar]
- Hansen, F. K., Cabella, P., Marinucci, D., & Vittorio, N. 2004a, ApJ, 607, L67 [NASA ADS] [CrossRef] [Google Scholar]
- Hansen, F. K., Banday, A. J., & Górski, K. M. 2004b, MNRAS, 354, 641 [NASA ADS] [CrossRef] [Google Scholar]
- Hinshaw, G., Nolta, M. R., Bennett, C. L., et al. 2007, ApJS, 170, 288 [NASA ADS] [CrossRef] [Google Scholar]
- Hinshaw, G., Weiland, J. L., Hill, R. S., et al. 2009, ApJS, 180, 225 [NASA ADS] [CrossRef] [Google Scholar]
- Hoftuft, J., Eriksen, H. K., Banday, A. J., et al. 2009, ApJ, 699, 9856 [NASA ADS] [CrossRef] [Google Scholar]
- Jarosik, N., Bennett, C. L., Dunkley, J., et al. 2011, ApJS, 192, 14 [NASA ADS] [CrossRef] [Google Scholar]
- Land, K., & Magueijo, J. 2005, MNRAS, 357, 994 [NASA ADS] [CrossRef] [Google Scholar]
- Paci, F., Gruppuso, A., Finelli, F., et al. 2010, MNRAS, 407, 399 [NASA ADS] [CrossRef] [Google Scholar]
- Pietrobon, D., Cabella, P., Balbi, A., et al. 2010, MNRAS, 402, 34 [Google Scholar]
- Planck Collaboration I. 2014, A&A, in press, DOI: 10.1051/0004-6361/201321529 [Google Scholar]
- Planck Collaboration XII. 2014, A&A, in press, DOI: 10.1051/0004-6361/201321580 [Google Scholar]
- Planck Collaboration XXIII. 2014, A&A, in press, DOI: 10.1051/0004-6361/201321534 [Google Scholar]
- Santos, L., Villela, T., & Wuensche, C. A. 2012, A&A, 544, A121 [NASA ADS] [CrossRef] [EDP Sciences] [Google Scholar]
- Schwarz, D. J., Starkman, G. D., Huterer, D., & Copi, C. J. 2004, Phys. Rev. Lett., 93, 1301 [Google Scholar]
- Smoot, G. F., Bennett, C. L., Kogut, A., et al. 1992, ApJ, 396, L1 [NASA ADS] [CrossRef] [Google Scholar]
- Spergel, D. N., Verde, L., Peiris, H. V., et al. 2003, ApJS, 148, 175 [NASA ADS] [CrossRef] [Google Scholar]
- Vielva, P. 2010, Adv. Astron., 2010, 592094 [Google Scholar]
- Vielva, P., & Sanz, J. L. 2010, MNRAS, 404, 895 [NASA ADS] [CrossRef] [Google Scholar]
- Vielva, P., Martínez-González, E., Barreiro, R. B., et al. 2004, ApJ, 609, 22 [NASA ADS] [CrossRef] [Google Scholar]
All Tables
Mean, 68.2%, 95%, and 99.7% C.L. values of the sigma ratios for different pair of quadrants using the simulated CMB maps considering the ΛCDM model.
Probabilities of finding in the MC simulations the σ value higher than the value found in Planck data for the SEQ and smaller than the values found for SWQ, NEQ, and NWQ in the Planck map.
Calculated probabilities of finding asymmetries equal to or higher than those found in Planck data in the MC simulations using both Planck and WMAP KQ85 mask considering the ΛCDM model.
Sigma ratios considering only SWQ, NWQ, and NEQ for Planck using both Planck and WMAP KQ85 mask.
All Figures
|
Fig. 1 TPCF curves computed for the main Planck temperature foreground-cleaned map (SMICA) (red curve) also using the mask provided by Planck team. We smoothed the curves using the smooth function from Interactive Data Language (IDL) for illustration purposes only (in the calculations we use the original calculated values for the TPCF). From top to bottom, NWQ, NEQ, SWQ, and SEQ appear as solid red lines. The shadow part depicts the standard deviation intervals (68% C.L) for 1000 simulated maps produced with the ΛCDM spectrum. The black curve is the mean TPCF considering the MC simulated maps. |
| In the text | |
|
Fig. 2 Comparison between the Planck foreground-cleaned maps (SMICA, NILC and SEVEM). From top to bottom, the curves refer to the NWQ, NEQ, SWQ, and SEQ |
| In the text | |
|
Fig. 3 Comparison between NWQ, NEQ, SWQ and SEQ (from top to bottom) for the TPCF using the WMAP KQ85 mask and the Planck mask for both maps: ILC WMAP7 and foreground-cleaned SMICA. |
| In the text | |
|
Fig. 4 Distribution of the σ values for each quadrant of the MC simulations. The black vertical line indicates where the mean value is located. The red line stands for the value found in SMICA + Planck mask. |
| In the text | |
|
Fig. 5 Distribution of the σ ratio between pair of quadrants. The black vertical line indicates where the mean value lies in the Monte Carlo simulations. The red line stands for the value found in SMICA + Planck mask. |
| In the text | |
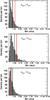 |
Fig. 6 Same as Fig. 5 for different pairs of quadrants. |
| In the text | |
|
Fig. 7 Top: anti-clockwise rotation performed in the SEQ with respect to z direction for 60, 30, 10, and 5 degrees. Bottom: clockwise rotation performed in SEQ with respect to z direction for 60, 30, 10, and 5 degrees. In both plots, the black curve corresponds to a 0 degree rotation. |
| In the text | |
Current usage metrics show cumulative count of Article Views (full-text article views including HTML views, PDF and ePub downloads, according to the available data) and Abstracts Views on Vision4Press platform.
Data correspond to usage on the plateform after 2015. The current usage metrics is available 48-96 hours after online publication and is updated daily on week days.
Initial download of the metrics may take a while.