Free Access
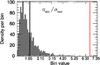
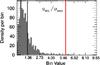
Fig. 5
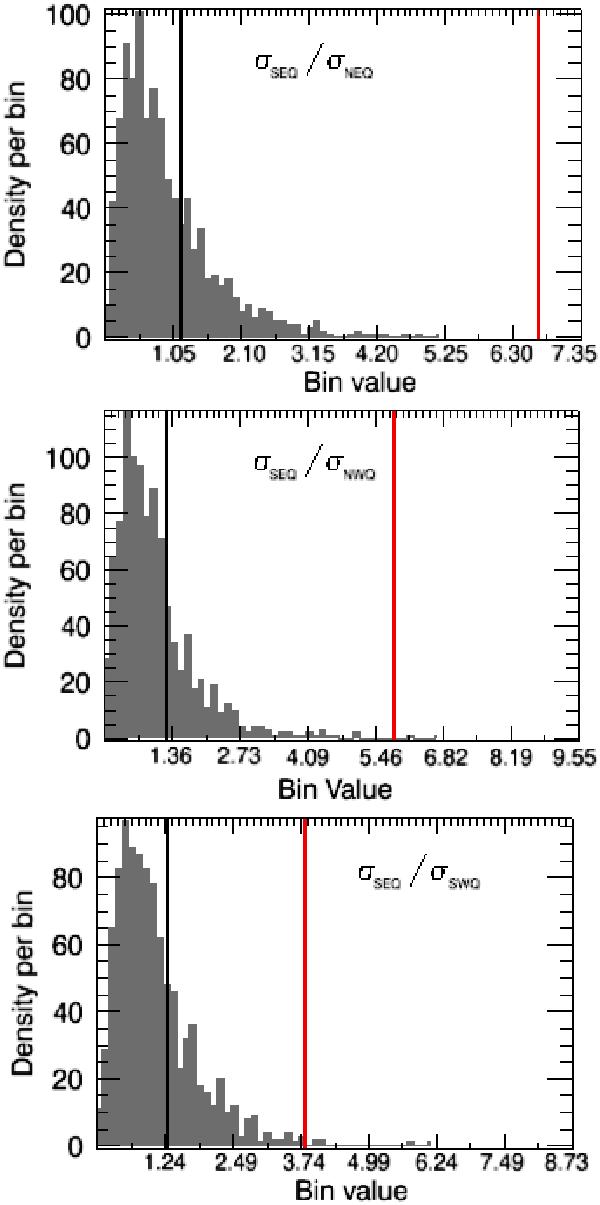
Distribution of the σ ratio between pair of quadrants. The black vertical line indicates where the mean value lies in the Monte Carlo simulations. The red line stands for the value found in SMICA + Planck mask.
This figure is made of several images, please see below:
Current usage metrics show cumulative count of Article Views (full-text article views including HTML views, PDF and ePub downloads, according to the available data) and Abstracts Views on Vision4Press platform.
Data correspond to usage on the plateform after 2015. The current usage metrics is available 48-96 hours after online publication and is updated daily on week days.
Initial download of the metrics may take a while.