Fig. 3
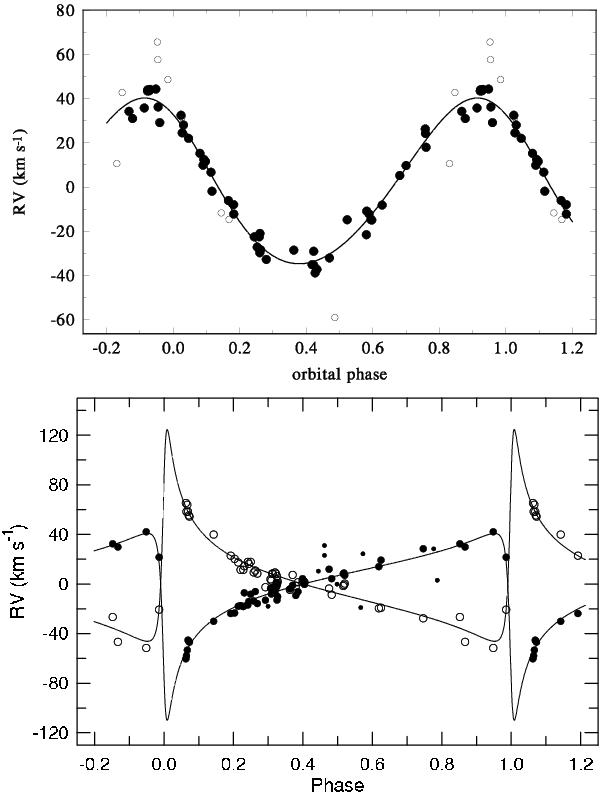
Phase plots for both binary orbits. Top panel: RVs of component Ba, prewhitened for the variations in the 470 d orbit and plotted vs. phase for the 6 d period and periastron epoch from Table 4. Open circles denote RVs from the literature. Bottom panel: RV curves of components A and B in the wide orbit. Open circles denote component A, filled circles component B (smaller ones for RVs from the literature). We note that in both plots, RVs −γ are plotted.
Current usage metrics show cumulative count of Article Views (full-text article views including HTML views, PDF and ePub downloads, according to the available data) and Abstracts Views on Vision4Press platform.
Data correspond to usage on the plateform after 2015. The current usage metrics is available 48-96 hours after online publication and is updated daily on week days.
Initial download of the metrics may take a while.