Fig. 4
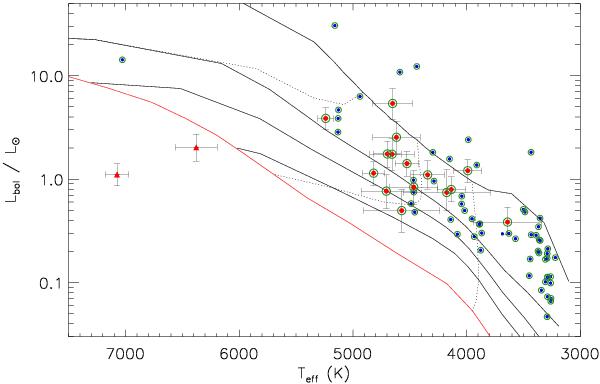
HR diagram of the UVES Li-members (red large dots), and HCMs (red triangles). All the “L08 mem” are marked with a green circle. The members targeted by GIRAFFE are shown as small blue dots. The dotted and solid black lines are the evolutionary tracks for 0.5, 1, and 2 M⊙ and isochrones for 1, 5, 10, and 20 Myr, respectively. The ZAMS is marked with a solid red line. The evolutionary tracks, the isochrones and the ZAMS are from the stellar models of Siess et al. (2000) for a chemical composition with Z = 0.01.
Current usage metrics show cumulative count of Article Views (full-text article views including HTML views, PDF and ePub downloads, according to the available data) and Abstracts Views on Vision4Press platform.
Data correspond to usage on the plateform after 2015. The current usage metrics is available 48-96 hours after online publication and is updated daily on week days.
Initial download of the metrics may take a while.