Free Access
Fig. 10
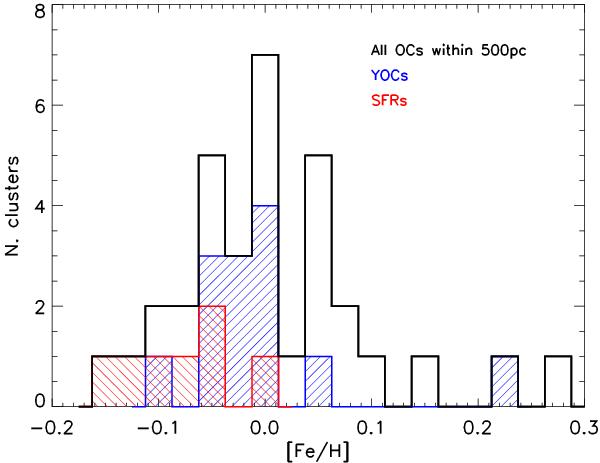
[Fe/H] distribution of the open clusters and SFRs in the solar neighborhood within a distance of 500 pc. Adopted ages, distances, and metallicity values are listed in Table 1. The red and blue colors denote the SFRs and YOCs subsamples, respectively.
Current usage metrics show cumulative count of Article Views (full-text article views including HTML views, PDF and ePub downloads, according to the available data) and Abstracts Views on Vision4Press platform.
Data correspond to usage on the plateform after 2015. The current usage metrics is available 48-96 hours after online publication and is updated daily on week days.
Initial download of the metrics may take a while.