Free Access
Fig. 1
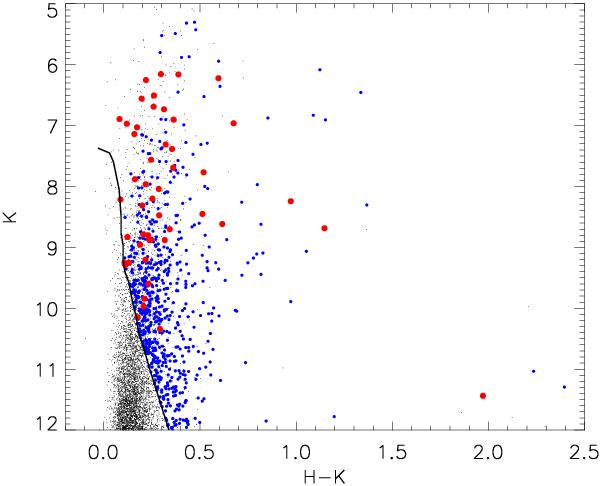
Infrared color−magnitude diagram for the stars lying in the cluster field and having RUSNO ≤ 17.0. The black line represents the 10 Myr isochrone using Siess et al. (2000) models. Blue (small) and red (large) dots are the stars targeted with GIRAFFE and UVES, respectively.
Current usage metrics show cumulative count of Article Views (full-text article views including HTML views, PDF and ePub downloads, according to the available data) and Abstracts Views on Vision4Press platform.
Data correspond to usage on the plateform after 2015. The current usage metrics is available 48-96 hours after online publication and is updated daily on week days.
Initial download of the metrics may take a while.