Press Release
Free Access
Fig. 4
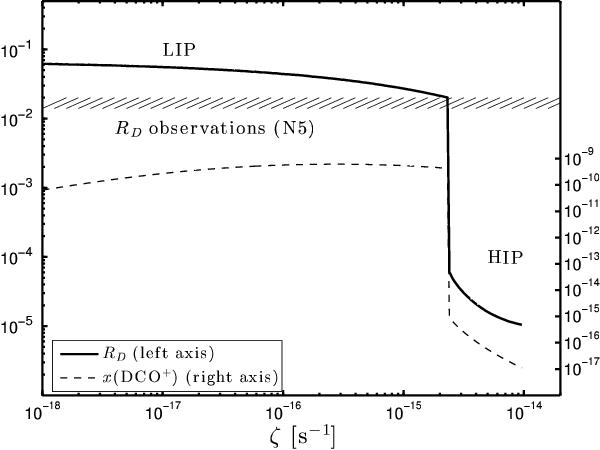
RD = DCO+/ HCO+ (thick line, left axis) and x(DCO+) = n(DCO+) /nH (dashed line, right axis) as a function of ζ, for T = 10 K and nH = 8 103 cm-3, i.e. the physical conditions characterising position N5. The HIP and LIP are marked. The hatched area shows the range of observed RD at that position.
Current usage metrics show cumulative count of Article Views (full-text article views including HTML views, PDF and ePub downloads, according to the available data) and Abstracts Views on Vision4Press platform.
Data correspond to usage on the plateform after 2015. The current usage metrics is available 48-96 hours after online publication and is updated daily on week days.
Initial download of the metrics may take a while.