Fig. 2
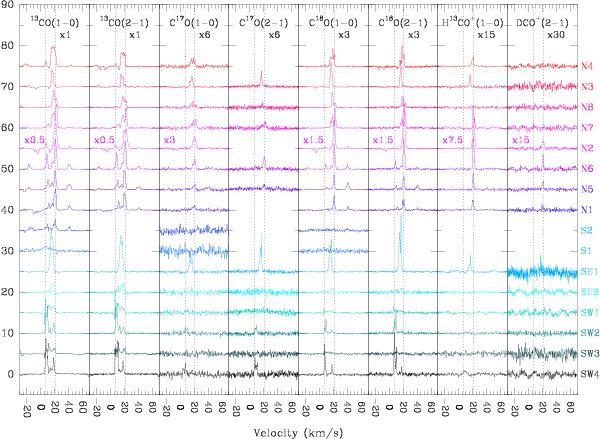
Observations of millimetre emission lines towards all positions. The intensities are in units of main-beam temperature (K). For readibility, a multiplicative factor was applied to the spectra and is given under each transition line label. This factor was decreased for position N2 (protostar) where the signal is very strong. Vertical dashed lines indicate the two extreme velocity components of the complex at 7 and 21 km s-1.
Current usage metrics show cumulative count of Article Views (full-text article views including HTML views, PDF and ePub downloads, according to the available data) and Abstracts Views on Vision4Press platform.
Data correspond to usage on the plateform after 2015. The current usage metrics is available 48-96 hours after online publication and is updated daily on week days.
Initial download of the metrics may take a while.