Fig. 1
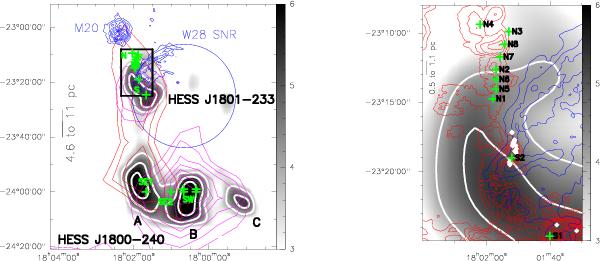
Left: the W28 complex on large scales. Grayscale (in σ) and thick contours show TeV emission as seen by HESS (levels are 4−6σ). Red contours show the CO(1−0) emission (Dame et al. 2001) integrated over 15−25 km s-1 and magenta contours trace the emission integrated over 5−15 km s-1 (levels are 40−70 K km s-1 by 5 K km s-1). Crosses show the positions observed with the IRAM 30m telescope and discussed in this paper. The blue contours show the 20 cm free-free emission in the M20 region (Yusef-Zadeh et al. 2000). The blue circle gives the approximate radio boundary of the SNR W28 (Brogan et al. 2006). Right: the northern cloud in the W28 complex (zoom on the black box). The red contours show the CO(3−2) emission in K km s-1, integrated over 15−25 km s-1 (levels are 15−130 K km s-1 by 5 K km s-1) (Lefloch et al. 2008). Diamonds show the locations of OH masers in the region (Claussen et al. 1997).
Current usage metrics show cumulative count of Article Views (full-text article views including HTML views, PDF and ePub downloads, according to the available data) and Abstracts Views on Vision4Press platform.
Data correspond to usage on the plateform after 2015. The current usage metrics is available 48-96 hours after online publication and is updated daily on week days.
Initial download of the metrics may take a while.