Fig. 7
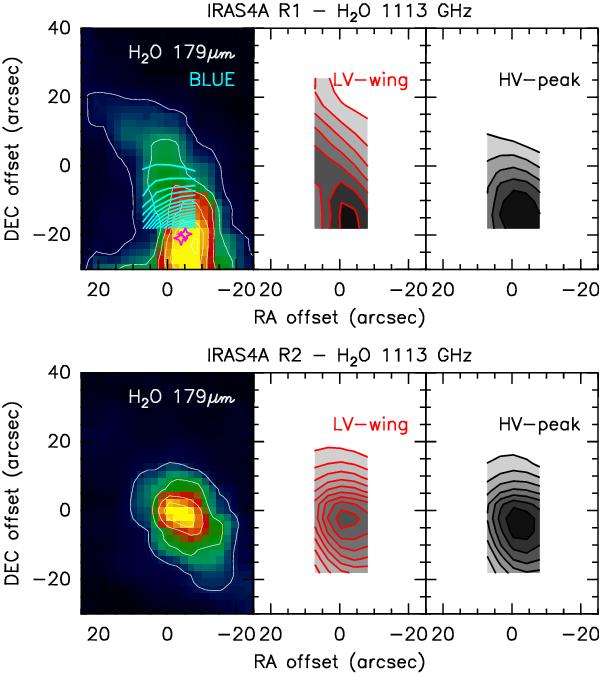
Velocity-integrated maps of the HIFI H2O 1113 GHz emission at the R1 (upper panel) and R2 (lower panel) positions compared with the PACS H2O 179 μm map. At R1, the H2O 1113 GHz emission is integrated in three velocity ranges: the blue-shifted emission (between −20 km s-1 and 3 km s-1), the low-velocity (LV) wing emission (between 11 km s-1 and 20 km s-1), and the high-velocity (HV) emission peak (between 20 km s-1 and 30 km s-1). At R2, two velocity ranges are considered: the LV wing emission (between 11 km s-1 and 30 km s-1) and the HV emission peak (between 30 km s-1 and 45 km s-1). The contour levels start from the 5σ level and increase in steps of 10σ for the PACS 179 μm emission and in steps of 3σ for the HIFI 1113 GHz emission. Offsets are with respect to the R1 and R2 shock positions. The magenta symbols represent the position of the IRAS 4A binary source.
Current usage metrics show cumulative count of Article Views (full-text article views including HTML views, PDF and ePub downloads, according to the available data) and Abstracts Views on Vision4Press platform.
Data correspond to usage on the plateform after 2015. The current usage metrics is available 48-96 hours after online publication and is updated daily on week days.
Initial download of the metrics may take a while.