Fig. 6
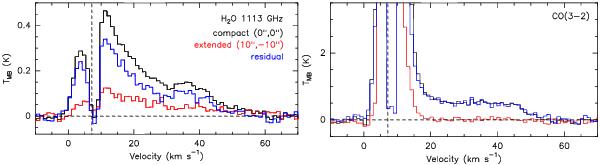
Left: comparison between the H2O 111 − 000 emission at 1113 GHz (19′′ beam size) at the R2 shock position (black), corresponding to the compact gas component, and that at the offset position (10′′, −10′′) with respect to R2 (red), corresponding to the extended component. The residual spectrum, given by the difference between the two displayed spectra, is shown in blue. Offsets are with respect to R2. The vertical dashed line indicates the source velocity. Right: same as the left panel for the CO (3−2) emission.
Current usage metrics show cumulative count of Article Views (full-text article views including HTML views, PDF and ePub downloads, according to the available data) and Abstracts Views on Vision4Press platform.
Data correspond to usage on the plateform after 2015. The current usage metrics is available 48-96 hours after online publication and is updated daily on week days.
Initial download of the metrics may take a while.