Free Access
Fig. 5
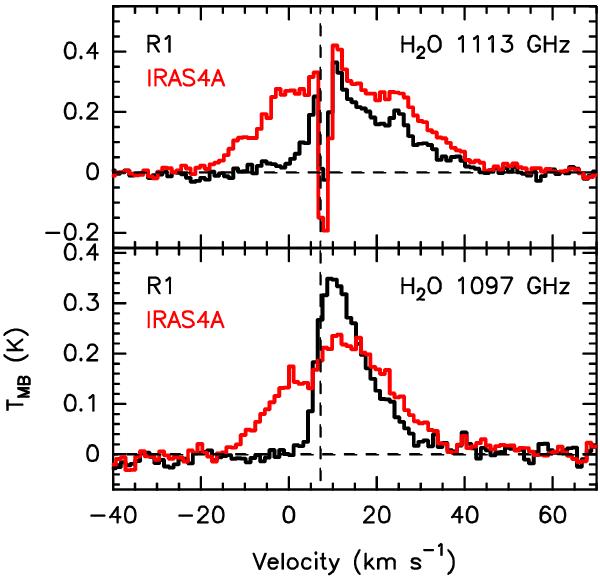
Comparison between the H2O (111 − 000) (1113 GHz) and (312 − 303) (1097 GHz) line profiles at R1 and on the IRAS 4A source. The vertical dashed line indicates the source velocity.
Current usage metrics show cumulative count of Article Views (full-text article views including HTML views, PDF and ePub downloads, according to the available data) and Abstracts Views on Vision4Press platform.
Data correspond to usage on the plateform after 2015. The current usage metrics is available 48-96 hours after online publication and is updated daily on week days.
Initial download of the metrics may take a while.