Free Access
Fig. 4
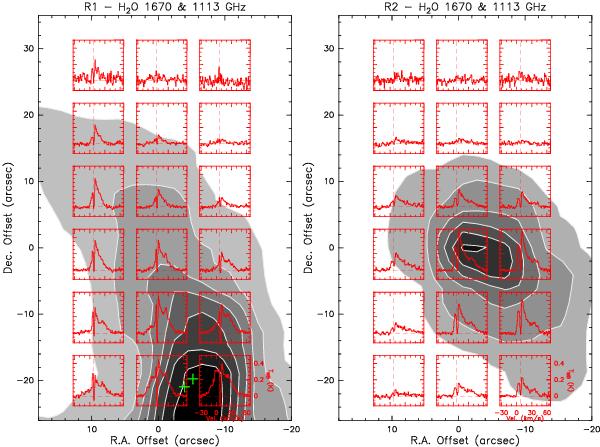
HIFI spectra of the 1113 GHz H2O line, mapped at R1 (left) and R2 (right). The spectra are overlaid on the respective PACS H2O map at 1670 GHz (grey scale and white contours). Offsets are with respect to the R1 and R2 shock positions. The IRAS 4A binary source position is marked with green crosses.
This figure is made of several images, please see below:
Current usage metrics show cumulative count of Article Views (full-text article views including HTML views, PDF and ePub downloads, according to the available data) and Abstracts Views on Vision4Press platform.
Data correspond to usage on the plateform after 2015. The current usage metrics is available 48-96 hours after online publication and is updated daily on week days.
Initial download of the metrics may take a while.