Fig. 3
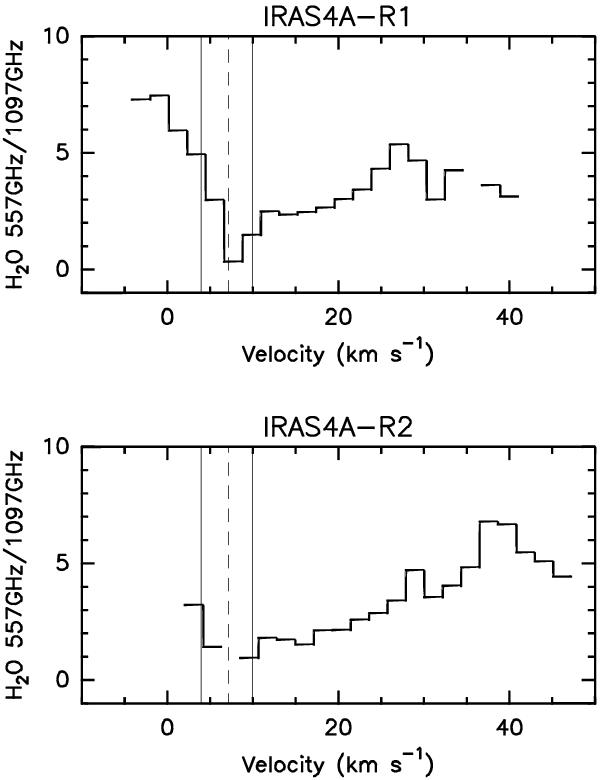
Ratio between the o-H2O (110 − 101) (at 557 GHz) and o-H2O (312 − 303) (at 1097 GHz) lines as a function of velocity at the two observed shock positions R1 (upper panel) and R2 (lower panel). The 1097 GHz water spectra are convolved to the same angular resolution as the 557 GHz spectra, i.e., 38′′. The line ratios are plotted only where the S/N ratio is higher than three for the two lines, at a spectral resolution of 2 km s-1. The vertical dashed line indicates the source velocity, whereas the solid vertical lines mark the velocity range of the absorption dip (4−10 km s-1).
Current usage metrics show cumulative count of Article Views (full-text article views including HTML views, PDF and ePub downloads, according to the available data) and Abstracts Views on Vision4Press platform.
Data correspond to usage on the plateform after 2015. The current usage metrics is available 48-96 hours after online publication and is updated daily on week days.
Initial download of the metrics may take a while.