Fig. 2
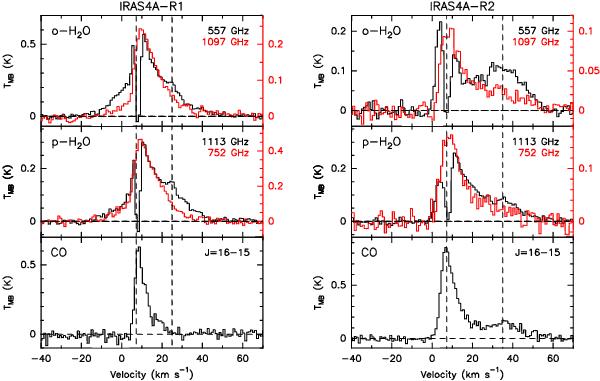
HIFI spectra of the H2O and CO transitions observed at the R1 (left) and R2 (right) shock positions along IRAS 4A. The spectra are all convolved to the same angular resolution of the H2O (110 − 101) line at 557 GHz (~38′′), with the exception of the CO (16−15) line, which is a single pointing HIFI observation at ~12′′ resolution. The spectra shown in red have intensities provided in the right-hand axes. The vertical dashed line marks the systemic velocity (vLSR = + 7.2 km s-1) and the H2O secondary emission peaks at +25 and +35 km s-1 for R1 and R2.
Current usage metrics show cumulative count of Article Views (full-text article views including HTML views, PDF and ePub downloads, according to the available data) and Abstracts Views on Vision4Press platform.
Data correspond to usage on the plateform after 2015. The current usage metrics is available 48-96 hours after online publication and is updated daily on week days.
Initial download of the metrics may take a while.