Free Access
Fig. A.1
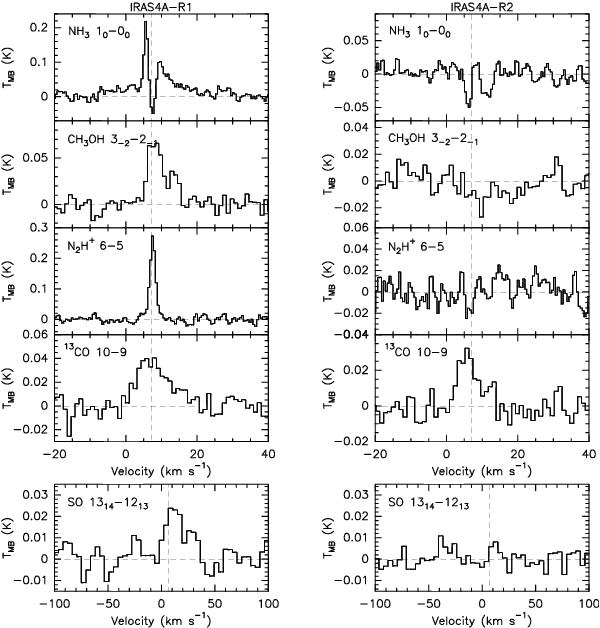
Additional lines observed with HIFI at the selected shock positions. All observations were taken in single-pointing mode, with the exception of the 13CO (10−9) line. The absorption features seen in the NH3 spectrum at R2 are due to contamination from emission in the off-source reference position.
Current usage metrics show cumulative count of Article Views (full-text article views including HTML views, PDF and ePub downloads, according to the available data) and Abstracts Views on Vision4Press platform.
Data correspond to usage on the plateform after 2015. The current usage metrics is available 48-96 hours after online publication and is updated daily on week days.
Initial download of the metrics may take a while.