Fig. 1
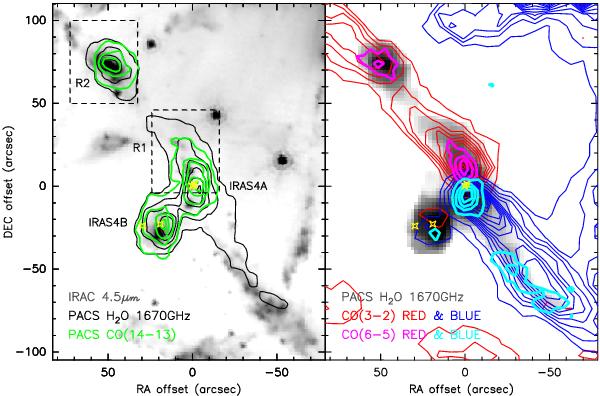
PACS map of the H2O (212 − 101) emission at 1670 GHz of the IRAS 4 region compared with the Spitzer-IRAC emission at 4.5 μm and the CO (14−13) emission in the left panel and with the JCMT CO (3−2) and APEX CO (6−5) emission (Yıldız et al. 2012) in the right panel. The CO (3−2) and CO (6−5) maps are integrated in the velocity ranges between −20 km s-1 and 3 km s-1 for the blue-shifted emission and 12 km s-1 and 50 km s-1 for the red-shifted emission. The contour levels start at the 5σ level and increase in steps of 10σ for the PACS H2O and CO (14−13) maps, from the 5σ level emission in steps of 5σ for the CO (3−2) and from the 5σ level emission in steps of 3σ for the CO (6−5). Offsets are with respect to the central source IRAS 4A, at coordinates αJ2000 = 03h29m10.s50, δJ2000 = + 31°13′30 9. The positions of the IRAS 4A and IRAS 4B binary sources are marked with yellow symbols (Looney et al. 2000). The regions mapped with HIFI in the water lines around the selected shock positions (R1 and R2) are indicated.
Current usage metrics show cumulative count of Article Views (full-text article views including HTML views, PDF and ePub downloads, according to the available data) and Abstracts Views on Vision4Press platform.
Data correspond to usage on the plateform after 2015. The current usage metrics is available 48-96 hours after online publication and is updated daily on week days.
Initial download of the metrics may take a while.