| Issue |
A&A
Volume 568, August 2014
|
|
|---|---|---|
| Article Number | A37 | |
| Number of page(s) | 6 | |
| Section | Interstellar and circumstellar matter | |
| DOI | https://doi.org/10.1051/0004-6361/201423997 | |
| Published online | 08 August 2014 | |
First detection of [N II] 205 μm absorption in interstellar gas
Herschel-HIFI observations towards W 31C, W 49N, W 51, and G34.3+0.1⋆,⋆⋆
1 Chalmers University of Technology, Department of Earth and Space Sciences, Onsala Space Observatory, 439 92 Onsala, Sweden
e-mail: This email address is being protected from spambots. You need JavaScript enabled to view it.
2 LERMA-LRA, UMR 8112 du CNRS, Observatoire de Paris, École Normale Supérieure, UPMC & UCP, 24 rue Lhomond, 75231 Paris Cedex 05, France
3 Tata Institute of Fundamental Research, Homi Bhabha Road, 400005 Mumbai, India
4 Instituto de Ciencia de Materiales de Madrid (ICMM-CSIC), 28049 Cantoblanco, Madrid, Spain
5 Department of Physics & Astronomy, Siena College, Loudonville NY 12211, USA
6 Max-Planck-Institut für Radioastronomie, Auf dem Hügel 69, 53121 Bonn, Germany
7 Institut de Radioastronomie Millimétrique, 300 rue de la Piscine, 38406 Saint-Martin-d’ Hères, France
Received: 14 April 2014
Accepted: 11 June 2014
Abstract
We present high resolution [N ii] 205 μm (3P1 − 3P0) spectra obtained with Herschel-HIFI towards a small sample of far-infrared bright star forming regions in the Galactic plane: W 31C (G10.6−0.4), W 49N (G43.2−0.1), W 51 (G49.5−0.4), and G34.3+0.1. All sources display an emission line profile associated directly with the H ii regions themselves. For the first time we also detect absorption of the [N ii] 205 μm line by extended low-density foreground material towards W 31C and W 49N over a wide range of velocities. We attribute this absorption to the warm ionised medium (WIM) and find N(N+) ≈ 1.5 × 1017 cm-2 towards both sources. This is in agreement with recent Herschel-HIFI observations of [C ii] 158 μm, also observed in absorption in the same sight-lines, if ≈7–10% of all C+ ions exist in the WIM on average. Using an abundance ratio of [N] / [H] = 6.76 × 10⁻⁵ in the gas phase we find that the mean electron and proton volume densities are ~0.1–0.3 cm-3 assuming a WIM volume filling fraction of 0.1–0.4 with a corresponding line-of-sight filling fraction of 0.46–0.74. A low density and a high WIM filling fraction are also supported by RADEX modelling of the [N ii] 205 μm absorption and emission together with visible emission lines attributed mainly to the WIM. The detection of the 205 μm line in absorption emphasises the importance of a high spectral resolution, and also offers a new tool for investigation of the WIM.
Key words: ISM: atoms / ISM: abundances / ISM: structure / line: formation / atomic processes / Galaxy: general
Appendix A is available in electronic form at http://www.aanda.org
Herschel is an ESA space observatory with science instruments provided by European-led Principal Investigator consortia and with important participation from NASA.
© ESO, 2014
1. Introduction
Among the brightest far-infrared spectral lines in the Galaxy are the forbidden transitions of singly ionised nitrogen at 122 and 205 μm providing useful probes of the Galactic large-scale and spiral structure. These transitions are unfortunately generally inaccessible to ground based facilities because of the opaque atmosphere at these frequencies. The 205 μm transition of N+ was first detected using FIRAS onboard COBE (Wright et al. 1991; Fixsen et al. 1999). FIRAS performed the first nearly all-sky far-infrared survey of the Galactic emission at wavelengths between ~100 μm and 1 cm and detected the strong and widespread emission from the forbidden transitions [C ii] 158 μm and [N ii] 205 μm, although with low spatial and spectral resolution. Since the ionisation potential of nitrogen is 14.53 eV, the [N ii] emission originates in the ionised gas in localised H ii regions and in the widespread warm and low-density ionised interstellar gas (WIM; review by Haffner et al. 2009). This is in contrast to the bulk of ionised carbon emission which traces the cold neutral medium (CNM). While the [N ii] emission from a discrete source was first detected using the Kuiper Airborne Observatory towards the H ii region G333.6−0.2 (Colgan et al. 1993), more recently [N ii] emission from the Carina Nebula was detected for the first time using a ground-based telescope Oberst et al. (2006, 2011, SPIFI on AST/RO at the south pole).
Source sample: properties and resulting continuum intensities and noise levels.
Fine-structure levels within the ground term of N+ will be excited mainly by electrons in the WIM and nebular regions and by both electrons and H atoms in the mostly neutral CNM and warm neutral medium. The rates of electron collisions at kinetic temperature TK ~ 8000 K compete with radiative rates when the electron density is ~40 cm-3 while the corresponding neutral density would need to exceed 100 cm-3. Thus in gas at lower densities, like the WIM at ne< 1 cm-3, the [N ii] excitation will remain very subthermal, and since the volume filling fraction of the WIM is estimated to be ~0.1–0.4 (Haffner et al. 2009), extended regions in the Galaxy will be difficult to probe with [N ii] emission without sufficient sensitivity. However, the diffuse interstellar gas with little or no excitation can be probed with high sensitivity in absorption along sight-lines towards bright far-infrared continuum sources. Therefore, the diffuse ionised nitrogen, which has previously only been observed in emission, can be detected in absorption towards a strong continuum background source at high spectral resolution. The lines need to be spectrally resolved in order to prevent blending of the weak foreground absorption features with the stronger background emission which may even lead to partial or complete disappearance of the background emission by the foreground absorption. The sensitive Heterodyne Instrument for the Far-Infrared (HIFI) onboard the Herschel Space Telescope, designed to perform very high spectral resolution observations at THz frequencies (0.48–1.25 THz and 1.41–1.91 THz), enabled such observations of the [N ii] 205 μm line. In the framework of the Herschel (Pilbratt et al. 2010; Roelfsema et al. 2012) key programme PRISMAS1 (PRobing InterStellar Molecules with Absorption line Studies) absorption in numerous molecular and atomic lines has been studied towards a sample of massive star forming regions in the Galactic plane (e.g. Gerin et al. 2010; Neufeld et al. 2010; Mookerjea et al. 2010; Falgarone et al. 2010; Persson et al. 2012).
In this paper, we present Herschel-HIFI observations of the [N ii] 205 μm transition towards W 31C, W 49N, W 51, and G34.3+0.1. The data are a part of the OT1 programme Diffuse ISM phases in the inner Galaxy (PI Maryvonne Gerin) in which the fine structure lines of ionised nitrogen and carbon and the ground and first excited states of neutral carbon were observed with the goal to characterise the diffuse neutral and ionised interstellar medium targeting the PRISMAS sources (e.g. Godard et al. 2010; Gerin et al. 2011; Flagey et al. 2013). The first results of the ionised and neutral carbon observations have recently been presented in Gerin et al. (2012, 2014).
2. Observations and data reduction
The observations of the [N ii] fine structure transition  at 205.178 μm (1 461.13190 GHz; Brown et al. 1994) are summarised in Table A.1. We note that the 205 μm transition has three hyperfine structure components where the second strongest component lies 1.5 km s-1 above the main component causing a slight broadening of the line profile. The targeted sources and their properties are listed in Table 1.
Because of the extended N+ emission across the Galaxy we used the load chop mode in which an internal cold load is used as reference. In this way possible contamination from weak emission in the off beam was minimised. This was complemented with observations in dual beam switching (DBS) fast chop mode allowing an even better measurement of the continuum than with the load chop mode. The reference beams in these observations were located within 3′ on either side of the source.
We used the upper sideband of band 6a and the wide band spectrometer (WBS) with a bandwidth of 4 × 1 GHz and an effective spectral resolution of 1.1 MHz (Δν = 0.23 km s-1). The half-power beam width of the telescope is 15.0′′ at 1 410 GHz and the calibration uncertainty is ≲13% for band 6a2.
The data were processed using the standard Herschel interactive processing environment (HIPE)3, version 11.1, up to level 2, providing fully calibrated double side band spectra in the  antenna temperature intensity scale where the lines are calibrated on a single side band (SSB) scale. Because HIFI is intrinsically a double side band instrument, the continuum has to be divided by two to be properly scaled. The FitHifiFringe task was used to fit and remove standing waves from the spectra. We also used the task hebCorrection in HIPE 12.1 as a second approach to remove the standing waves which gave very similar results to those obtained with FitHifiFringe. The FITS files were exported to the spectral line analysis software packages xs4 and CLASS5 which were used in parallel in the subsequent data reduction. Both polarisations were included in the averaged noise weighted spectra, and for the DBS data both LO-settings were also included. The resulting averages were convolved to a resolution of 1 km s-1. All spectra shown in the figures and used in the analysis are load chop data with continuum levels scaled to TC obtained from the DBS measurements. The DBS spectra were also used to check emission in the off-beam in Sect. 3.
3. Results
Figures 1–4 show the resulting [N ii] 205 μm data together with comparison spectra of the [C ii] 158 μm line (Gerin et al. 2012, 2014). We find [N ii] emission at the source velocities towards all four sources even though the emission from G34.3+0.1 is weak. In addition, we clearly detect, for the first time, ionised nitrogen in absorption towards W 31C and W 49N from low-density foreground material. A hint of absorption in the sight-line towards W 51 is also seen at νLSR ~ 20 − 40 km s-1.
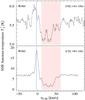 |
Fig. 1 Single sideband WBS spectra of [N ii] 205 μm and [C ii] 158 μm towards W 31C. The νLSR of the H ii region is marked in blue and the velocity of the line-of-sight gas is marked in red. Absorption of N+ traces the warm ionised medium, while the C+ absorption mainly traces the cold neutral medium, and, at ≈7–10% level also the WIM. |
The optical depths per unit velocity interval, τν, are derived from  (1)where J(Tex) = hνul/k × (exp(hνul/kTex) − 1)-1, νul is the frequency of the transition, and Tex the excitation temperature. We have here neglected the small contribution from the cosmic microwave background radiation and the Galactic radiation field. Assuming that J(Tex) ≪ TC (or Tex ≪ 27 K) we estimate the line opacities as
  . The total integrated opacities are obtained by summing over the line-of-sight velocities listed in Table 1. For W 51 and G34.3+0.1 we estimate upper limits using 3σ noise levels. The resulting integrated opacities,
  , are 3.2, 3.3, ≲1.6, and ≲1.5 km s-1 for W 31C, W 49N, W 51, and G34.3+0.1, respectively.
The N+ column densities in the foreground gas are estimated using the relation ![Mathematical equation: \begin{eqnarray} \label{N_lower} N(\mathrm{N}^+) = 8\pi \frac{\nu_\mathrm{ul}^3}{c^3} \frac{g_\mathrm{l}}{g_\mathrm{u}\,A_\mathrm{ul}} \int \tau_\nu \,\mathrm{d}\varv = 4.7 \times 10^{16} \int \tau_\nu \,\mathrm{d}\varv \, \, \, \mathrm{\left[cm^{-2}\right]} , \end{eqnarray}](/articles/aa/full_html/2014/08/aa23997-14/aa23997-14-eq37.png) (2)assuming that J(Tex) ≪ hνul/k = 70 K and that all N+ ions are in the ground state. Resulting column densities and upper limits are found in Table 2.
(2)assuming that J(Tex) ≪ hνul/k = 70 K and that all N+ ions are in the ground state. Resulting column densities and upper limits are found in Table 2.
In order to constrain the excitation temperature of the foreground gas towards W 31C and W 49N we compare the observed absorption line spectra with spectra taken towards positions close to the observed lines of sight, but offset from the background continuum. Such spectra could potentially show N ii emission. Equation (1) then becomes 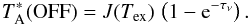 (3)We obtained the comparison OFF spectra by taking the difference of the load chop and DBS spectra to produce a mean spectrum of the OFF positions approximately 3′ from the line of sight. We do not detect any emission at the velocities corresponding to the foreground features in any of the OFF spectra, but we do find emission from the H ii regions at the source velocities not affecting the line-of-sight absorptions. We thus use the measured rms noise levels, ~0.12 K at a resolution of 1 km s-1, as limits for
  in the sight-lines together with the corresponding maximum opacity, τmax ≈ 0.11. In this way, we find Tex ≲ 17 K as an upper limit for the excitation temperature of N+ in the foreground gas. We note that this procedure assumes that the same component is responsible for both the emission and absorption. Some N+ can also exist in the neutral medium (see Sect. 4), but here the N+ abundances are expected to be several orders of magnitudes lower than those in the WIM.
4. Discussion
Since the ionisation potential of carbon is 11.3 eV the C+ ion largely traces the CNM, and to a lesser extent the WIM. The fraction of C+ ions existing in the WIM can be estimated from a comparison of the C+ and N+ column densities since the [N ii] 205 μm and the [C ii] 158 μm lines have nearly identical critical densities, hence their line ratio in the WIM is only a function of the [C]/[N] gas phase abundance ratio. We consider two cases: (i) [C] / [N] = 3.2 (Jensen et al. 2007; Sofia et al. 2004) which includes depletion in translucent and diffuse gas; and (ii) [C] / [N] = 4.0 using solar elemental abundances without depletion (Asplund et al. 2009). A comparison of these ratios with the derived N(C+) /N(N+) ratios listed in Table 2 suggests that on average ≈7–10% of all C+ ions exist in the WIM, in agreement with Gerin et al. (2014).
The fully ionised WIM allows an estimate of its column and average volume densities of ionised hydrogen via ![Mathematical equation: \begin{equation} \label{Hp column} N(\mathrm{H^+}) = N(\mathrm{N^+})\times (\mathrm{[N]/[H]})^{-1} \approx f \, n_\mathrm{H^+}\, s\ \ \left[\mathrm{cm^{-2}}\right] , \end{equation}](/articles/aa/full_html/2014/08/aa23997-14/aa23997-14-eq55.png) (4)where f is the filling factor of the WIM along the line of sight, and s is the distance to the source. We take for reference an abundance ratio [N] / [H] = 6.76 × 10⁻⁵ in the gas phase (Asplund et al. 2009). Since f cannot be higher than unity, the lower limits of the average nH+ towards W 31C and W 49N are ~0.15 and ~0.07 cm-3, respectively. Using more realistic values of the filling factor we find an average nH+~0.1 − 0.3 cm-3 (Table 2).
(4)where f is the filling factor of the WIM along the line of sight, and s is the distance to the source. We take for reference an abundance ratio [N] / [H] = 6.76 × 10⁻⁵ in the gas phase (Asplund et al. 2009). Since f cannot be higher than unity, the lower limits of the average nH+ towards W 31C and W 49N are ~0.15 and ~0.07 cm-3, respectively. Using more realistic values of the filling factor we find an average nH+~0.1 − 0.3 cm-3 (Table 2).
Emission lines of [N ii] are taken to trace ionised hydrogen and thus the rate of formation of massive stars that produce ionising photons in the Milky Way and in high-redshift starburst galaxies (e.g. Decarli et al. 2012). Zhao et al. (2013) used the low spectral resolution SPIRE instrument onboard Herschel to survey [N ii] 205 μm line emission in a sample of 70 local luminous infrared galaxies and found both low line to continuum flux ratios in the most luminous systems and an unexplained scatter in that ratio over the whole sample. Our detection of the 205 μm line in absorption from low-density foreground gas highlights the need for high spectral resolution in investigating N+ column densities in galaxies since absorption of the [N ii] line in low-density gas can affect the total integrated intensity of the line emission.
4.1. Radex modelling
Besides the emission lines in the submm at 205 and 122 μm, interstellar atomic nitrogen ions have also been observed at visible wavelengths (6583, 6548, and 5755 Å), and through absorption lines in the far ultraviolet (1084 Å). All these lines are thought to originate in a combination of localised photoionised nebulae and the widespread WIM. To demonstrate that our observed submm-wave absorption is quantitatively consistent with the emission lines attributed to the WIM we constructed a simple model using the non-LTE radiative transfer code RADEX6 (van der Tak et al. 2007).
In order to describe the observable intensities and optical depths of the N+ lines, we adopt term energies and transition probabilities from the NIST database7. Electron-impact collision strengths and additional transition probabilities are taken from Tayal (2011). Neutral-impact collision rates for the excitation of the ground-term fine-structure levels are not known; therefore, the corresponding rates for the isoelectronic neutral system H + C(3P) computed by Abrahamsson et al. (2007) have been scaled upwards by a factor of 5 for the ion-neutral system H + N .
.
We computed the spectrum of a 58-level N+ ion from submm to EUV wavelengths with RADEX and the atomic data described above and also estimated the Hα intensity for Case B recombination (Hummer & Storey 1987) for an assumed gas phase nitrogen abundance of [N] / [H] = 6.76 × 10⁻⁵. The model parameters are consistent with chemical modelling where the N+ ion is produced by cosmic ray ionisation of N and by charge transfer, H+ + N → H + N+, (Lin et al. 2005). The removal can be by direct radiative recombination and by dielectronic recombination (Nussbaumer & Storey 1983; Zatsarinny et al. 2004; Badnell 2006; Bryans et al. 2009) and by the reverse of the charge transfer reaction. In molecular regions N+ is also destroyed by reaction with H2, for which we adopt the rate coefficient recommended by Wakelam et al. (2012). The cosmic ray ionisation rate of hydrogen is taken to be ζ0 = 2 × 10-16 s-1 (see Indriolo et al. 2012) and that for nitrogen is 2.1ζ0. We assume that the abundance of N+ is governed by the rates of these formation and destruction processes in steady state. The abundance of N+ then depends only on the total density of hydrogen nuclei nH, the kinetic temperature of the gas TK, and the fractional abundances of electrons, fe, and hydrogen molecules, fH2.
Models of N+ in the WIM at TK = 8000 K reproduce both the submm-wave absorption towards W 49N and W 31C reported here and the intensities of [N ii] 6583, 5755, and Hα6563 Å reported by Reynolds et al. (2001). The latter refer to emission lines over a one-degree region in the direction G130.0 − 7.5 in several broad velocity components with corresponding kinematical distances between 0.6 kpc and 9.7 kpc. We estimate that the effect of dust extinction along the sight-lines is small compared with variations in (i) the total nitrogen abundance over 10 kpc sight-lines across the Galaxy; and (ii) variations in electron density and temperature. Models of column density N(N+) = 1.5 × 1017 cm-2 over a total linewidth Δν = 50 km s-1, in agreement with our results in Sect. 3, with uniform densities nH = 0.05 − 0.1 cm-3 and electron fractions fe ~ 1 yield an integrated optical depth ∫τ dν = 3.2 km s-1 in the 205 μm line. The same models produce the following intensities in the visible lines: Φ(6583) = 10 to 20 Rayleigh, somewhat larger than the 4.3 R observed; Φ(Hα) = 10 to 19 R, comparable to the observed 10.1 R; and I(5755) /I(6583) = 0.8%, close to the observed intensity ratio (0.96 ± 0.20)%.
In these models the excitation temperature of the 205 μm line is 9 − 10 K, which explains how this easily excited line can appear in absorption towards our submm-wave continuum sources: the integrated diffuse emission would be  K km s-1, well below our detection limits. The model intensity ratio of the two fine-structure lines, I(122) /I(205) ≈ 0.6 is somewhat smaller than the global average 1.1 ± 0.1 measured with the FIRAS instrument on the COBE satellite. The ratio is, however, consistent with that expected for diffuse gas since the higher observed ratio was due to higher density ionised gas closely associated with star forming regions excluded from the observations (Petuchowski & Bennett 1993). Models of the WIM or the neutral medium with fe< 0.5 yield optical intensity ratios I(6583) /I(Hα) that are much larger than observed in diffuse emission. Photoionised nebulae with densities ne ≫ 0.1 cm-3 can be ruled out because the 205 μm line would appear strongly in emission. Models of neutral, partly molecular gas at low temperature, TK ≲ 100 K, are unable to explain the observed absorption because the N+ abundance in neutral gas is too low at the adopted ionisation rate and the observed abundance would imply an amount of NH+ in conflict with observed upper limits (Persson et al. 2012, 2014). The total cooling provided by [N ii] in our models is dominated by the 6548 Å and 6583 Å transitions (86%), while the 205 μm and 122 μm fine-structure transitions account for 12%.
In summary, the RADEX modelling of the 205 μm absorption lines observed over long, ~5–10 kpc, sight-lines towards W 49N and W 31C are compatible with a widespread WIM at TK ~ 8000 K in which the density ne ≈ nH+ ~ 0.05 − 0.1 cm-3. The same conditions explain the diffuse optical emission lines of [N ii] and Hα (Reynolds et al. 2001). The real interstellar medium is, however, more complex than our static, uniform models; in particular, the WIM represents an average over space and time of wildly varying conditions (Dong & Draine 2011).
Online material
Appendix A: Additional Table
Herschel observational identifications (OBSIDs) of the observed [N ii] 1 461 GHz transition in HIFI band 6a presented in this paper.
http://www.nist.gov/pml/data/asd.cfm is the Atomic Spectra Database version 5.1 maintained by the US National Institute of Standards and Technology: Kramida et al. (2013).
Acknowledgments
HIFI has been designed and built by a consortium of institutes and university departments from across Europe, Canada and the United States under the leadership of SRON Netherlands Institute for Space Research, Groningen, The Netherlands and with major contributions from Germany, France and the US. Consortium members are: Canada: CSA, U.Waterloo; France: CESR, LAB, LERMA, IRAM; Germany: KOSMA, MPIfR, MPS; Ireland: NUI Maynooth; Italy: ASI, IFSI-INAF, Osservatorio Astrofisico di Arcetri-INAF; Netherlands: SRON, TUD; Poland: CAMK, CBK; Spain: Observatorio Astronómico Nacional (IGN), Centro de Astrobiología (CSIC-INTA). Sweden: Chalmers University of Technology – MC2, RSS & GARD; Onsala Space Observatory; Swedish National Space Board, Stockholm University – Stockholm Observatory; Switzerland: ETH Zurich, FHNW; USA: Caltech, JPL, NHSC. C.M.P. and J.H.B. acknowledge generous support from the Swedish National Space Board. J.R.G. thanks the Spanish MINECO for funding support under grants CSD2009-00038, AYA2009-07304 and AYA2012-32032. Thanks also to Paul Goldsmith and the anonymous referee whose constructive comments improved the paper.
References
- Abrahamsson, E., Krems, R. V., & Dalgarno, A. 2007, ApJ, 654, 1171 [NASA ADS] [CrossRef] [Google Scholar]
- Asplund, M., Grevesse, N., Sauval, A. J., & Scott, P. 2009, ARA&A, 47, 481 [NASA ADS] [CrossRef] [Google Scholar]
- Badnell, N. R. 2006, ApJS, 167, 334 [NASA ADS] [CrossRef] [Google Scholar]
- Brown, J. M., Varberg, T. D., Evenson, K. M., & Cooksy, A. L. 1994, ApJ, 428, L37 [NASA ADS] [CrossRef] [Google Scholar]
- Bryans, P., Kreckel, H., Roueff, E., Wakelam, V., & Savin, D. W. 2009, ApJ, 694, 286 [NASA ADS] [CrossRef] [Google Scholar]
- Colgan, S. W. J., Haas, M. R., Erickson, E. F., et al. 1993, ApJ, 413, 237 [NASA ADS] [CrossRef] [Google Scholar]
- Decarli, R., Walter, F., Neri, R., et al. 2012, ApJ, 752, 2 [NASA ADS] [CrossRef] [Google Scholar]
- Dong, R., & Draine, B. T. 2011, ApJ, 727, 35 [NASA ADS] [CrossRef] [Google Scholar]
- Falgarone, E., Godard, B., Cernicharo, J., et al. 2010, A&A, 521, L15 [NASA ADS] [CrossRef] [EDP Sciences] [Google Scholar]
- Fixsen, D. J., Bennett, C. L., & Mather, J. C. 1999, ApJ, 526, 207 [NASA ADS] [CrossRef] [Google Scholar]
- Flagey, N., Goldsmith, P. F., Lis, D. C., et al. 2013, ApJ, 762, 11 [NASA ADS] [CrossRef] [Google Scholar]
- Gerin, M., de Luca, M., Black, J., et al. 2010, A&A, 518, L110 [NASA ADS] [CrossRef] [EDP Sciences] [Google Scholar]
- Gerin, M., Kaźmierczak, M., Jastrzebska, M., et al. 2011, A&A, 525, A116 [NASA ADS] [CrossRef] [EDP Sciences] [Google Scholar]
- Gerin, M., Levrier, F., Falgarone, E., et al. 2012, Roy. Soc. London Philos. Trans. Ser. A, 370, 5174 [Google Scholar]
- Gerin, M., Ruaud, M., Goicoechea, J., et al. 2014, A&A, submitted [Google Scholar]
- Godard, B., Falgarone, E., Gerin, M., Hily-Blant, P., & de Luca, M. 2010, A&A, 520, A20 [NASA ADS] [CrossRef] [EDP Sciences] [Google Scholar]
- Haffner, L. M., Dettmar, R.-J., Beckman, J. E., et al. 2009, Rev. Mod. Phys., 81, 969 [NASA ADS] [CrossRef] [Google Scholar]
- Hummer, D. G., & Storey, P. J. 1987, MNRAS, 224, 801 [NASA ADS] [CrossRef] [Google Scholar]
- Indriolo, N., Neufeld, D. A., Gerin, M., et al. 2012, ApJ, 758, 83 [NASA ADS] [CrossRef] [Google Scholar]
- Jensen, A. G., Rachford, B. L., & Snow, T. P. 2007, ApJ, 654, 955 [NASA ADS] [CrossRef] [Google Scholar]
- Kuchar, T. A., & Bania, T. M. 1994, ApJ, 436, 117 [NASA ADS] [CrossRef] [Google Scholar]
- Lin, C. Y., Stancil, P. C., Gu, J. P., Buenker, R. J., & Kimura, M. 2005, Phys. Rev. A, 71, 2708 [Google Scholar]
- Mookerjea, B., Giesen, T., Stutzki, J., et al. 2010, A&A, 521, L13 [NASA ADS] [CrossRef] [EDP Sciences] [Google Scholar]
- Neufeld, D. A., Goicoechea, J. R., Sonnentrucker, P., et al. 2010, A&A, 521, L10 [NASA ADS] [CrossRef] [EDP Sciences] [Google Scholar]
- Nussbaumer, H., & Storey, P. J. 1983, A&A, 126, 75 [NASA ADS] [Google Scholar]
- Oberst, T. E., Parshley, S. C., Stacey, G. J., et al. 2006, ApJ, 652, L125 [NASA ADS] [CrossRef] [MathSciNet] [Google Scholar]
- Oberst, T. E., Parshley, S. C., Nikola, T., et al. 2011, ApJ, 739, 100 [NASA ADS] [CrossRef] [Google Scholar]
- Persson, C. M., De Luca, M., Mookerjea, B., et al. 2012, A&A, 543, A145 [NASA ADS] [CrossRef] [EDP Sciences] [Google Scholar]
- Persson, C. M., Hajigholi, M., Hassel, G. E., et al. 2014, A&A, 567, A130 [NASA ADS] [CrossRef] [EDP Sciences] [Google Scholar]
- Petuchowski, S. J., & Bennett, C. L. 1993, ApJ, 405, 591 [NASA ADS] [CrossRef] [Google Scholar]
- Pilbratt, G., Riedinger, J. R., Passvogel, T., et al. 2010, A&A, 518, L1 [CrossRef] [EDP Sciences] [Google Scholar]
- Reynolds, R. J., Sterling, N. C., Haffner, L. M., & Tufte, S. L. 2001, ApJ, 548, L221 [NASA ADS] [CrossRef] [Google Scholar]
- Roelfsema, P. R., Helmich, F. P., Teyssier, D., et al. 2012, A&A, 537, A17 [NASA ADS] [CrossRef] [EDP Sciences] [Google Scholar]
- Sanna, A., Reid, M. J., Menten, K. M., et al. 2014, ApJ, 781, 108 [NASA ADS] [CrossRef] [Google Scholar]
- Sato, M., Reid, M. J., Brunthaler, A., & Menten, K. M. 2010, ApJ, 720, 1055 [NASA ADS] [CrossRef] [Google Scholar]
- Sofia, U. J., Lauroesch, J. T., Meyer, D. M., & Cartledge, S. I. B. 2004, ApJ, 605, 272 [NASA ADS] [CrossRef] [Google Scholar]
- Tayal, S. S. 2011, ApJS, 195, 12 [NASA ADS] [CrossRef] [Google Scholar]
- van der Tak, F. F. S., Black, J. H., Schöier, F. L., Jansen, D. J., & van Dishoeck, E. F. 2007, A&A, 468, 627 [NASA ADS] [CrossRef] [EDP Sciences] [Google Scholar]
- Wakelam, V., Herbst, E., Loison, J.-C., et al. 2012, ApJS, 199, 21 [NASA ADS] [CrossRef] [Google Scholar]
- Wright, E. L., Mather, J. C., Bennett, C. L., et al. 1991, ApJ, 381, 200 [NASA ADS] [CrossRef] [Google Scholar]
- Zatsarinny, O., Gorczyca, T. W., Korista, K. T., Badnell, N. R., & Savin, D. W. 2004, A&A, 417, 1173 [NASA ADS] [CrossRef] [EDP Sciences] [Google Scholar]
- Zhang, B., Reid, M. J., Menten, K. M., et al. 2013, ApJ, 775, 79 [NASA ADS] [CrossRef] [Google Scholar]
- Zhao, Y., Lu, N., Xu, C. K., et al. 2013, ApJ, 765, L13 [NASA ADS] [CrossRef] [Google Scholar]
All Tables
Herschel observational identifications (OBSIDs) of the observed [N ii] 1 461 GHz transition in HIFI band 6a presented in this paper.
All Figures
|
Fig. 1 Single sideband WBS spectra of [N ii] 205 μm and [C ii] 158 μm towards W 31C. The νLSR of the H ii region is marked in blue and the velocity of the line-of-sight gas is marked in red. Absorption of N+ traces the warm ionised medium, while the C+ absorption mainly traces the cold neutral medium, and, at ≈7–10% level also the WIM. |
| In the text | |
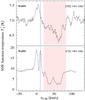 |
Fig. 2 W 49N. Notation as in Fig. 1. |
| In the text | |
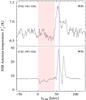 |
Fig. 3 W 51. Notation as in Fig. 1. |
| In the text | |
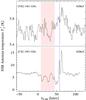 |
Fig. 4 G34.3+0.1. Notation as in Fig. 1. |
| In the text | |
Current usage metrics show cumulative count of Article Views (full-text article views including HTML views, PDF and ePub downloads, according to the available data) and Abstracts Views on Vision4Press platform.
Data correspond to usage on the plateform after 2015. The current usage metrics is available 48-96 hours after online publication and is updated daily on week days.
Initial download of the metrics may take a while.