| Issue |
A&A
Volume 568, August 2014
|
|
|---|---|---|
| Article Number | A80 | |
| Number of page(s) | 8 | |
| Section | Planets and planetary systems | |
| DOI | https://doi.org/10.1051/0004-6361/201423769 | |
| Published online | 22 August 2014 | |
Cometary emissions induced by scattering and fluorescence of solar X-rays
Department of Physics, University of Connecticut, Storrs CT 06269, USA
e-mail: This email address is being protected from spambots. You need JavaScript enabled to view it.
Received: 6 March 2014
Accepted: 1 July 2014
Abstract
To establish the nature of cometary X-ray emissions above 1 keV, detailed modeling of scattering and fluorescence of solar X-rays by a cometary atmosphere is carried out over the 0.3−3.0 keV photon energy range. Computations of the X-ray emissions are performed for different distributions of the cometary neutral gas, dust, and ice grains, with an emphasis placed on nano-sized particles. The calculated emission spectra of energetic photons above 1 keV are compared to cometary observations performed by the Chandra X-ray Observatory, and emission contributions solely from cometary neutral gas are found to be an insufficient X-ray production mechanism. Further comparison between the developed model and observational data also establishes an upper limit on dust and ice nanoparticle density distributions in cometary atmospheres. In addition, similarities in spectral shape above 1 keV observed between cometary emissions, Jovian disk emissions, and scattered solar X-ray spectra during solar flare events are discussed in detail.
Key words: comets: general / line: formation / Sun: flares / X-rays: general
© ESO, 2014
1. Introduction
As comets pass through the solar system, they absorb solar energy and eject atoms, dust, and ice particles. Fluxes of neutral material created at the nuclear surface propagate outward with velocities of a few km s-1, often forming jet-streams (A’Hearn et al. 2011). This neutral ejecta forms a diffuse cometary atmosphere that undergoes significant transformation because of photo-chemical reactions, dissociation of molecular species, and fragmentation of dust and ice particles. The neutral atmospheric gas can be ionized by solar radiation or solar wind (SW) plasma. Neutral atoms and molecules may also be ionized by energetic SW electrons or lose electrons in charge-exchange collisions with SW ions, known as solar wind charge exchange (SWCX; Krasnopolsky 1997; Kharchenko et al. 2003; Lisse et al. 2004). Collisions between highly charged, heavy SW ions, such as C6+, N6+, O7+, O8+, Mg9+, and Ne9+, and neutral cometary particles have been identified as the major source of cometary X-ray photons with energies below 1 keV, as defined by the electron energy levels of such ions (Kharchenko et al. 2003). Scattering and fluorescence (SF) of solar X-rays also contribute to the observed X-ray intensities, but their contributions at photon energies below 1 keV have been estimated to be a minor fraction of the total flux of cometary X-rays (Krasnopolsky 1997; Krasnopolsky et al. 2004).
Recently, comet observations using the Chandra X-ray Observatory have shown emission spectra above 1 keV with unresolved spectral features, or peaks, for several comets (Ewing et al. 2013). Current interpretation of observed spectra suggest that these hard X-ray peaks are a result of SWCX with abnormal, highly ionized SW ions like Mg11+ and Si13+ (Bodewits et al. 2007; Ewing et al. 2013). However, in situ observations with mass spectrometers have not detected these highly charged ions (Lepri et al. 2013; von Steiger et al. 2000). Theoretical models describing the charge abundance of heavy SW ions also predict an extremely low probability of finding Mg11+ and Si13+ in the SW plasma because of the inability to reach such high freezing-in temperatures in regular SW and coronal mass ejections (Bochsler 2007). At the same time, solar X-ray emissions with photon energies above 1 keV have been observed to increase by 1−3 orders of magnitude during solar flares (Neupert 2006). It is therefore possible that scattering of energetic X-ray photons and fluorescence by heavy elements from the cometary environment would also increase by 1−3 orders of magnitude during high solar activity. Such an increase may even result in SF providing more significant contributions toward cometary X-ray emissions than SWCX. Accurate SF spectra of cometary X-ray emission should therefore be factored into spectral models.
In addition to the lack of direct detection of highly charged, heavy SW ions able to induce X-ray emissions above 1 keV, our research is also motivated by detection of X-ray emissions observed from planetary atmospheres, known as planetary disk X-ray emissions (Bhardwaj et al. 2007; Branduardi-Raymont et al. 2007, 2008). The SF of solar X-rays by Earth’s disk have been studied in detail. Comparisons between models and observational X-ray emission spectra from Earth’s disk are described in several articles (Bhardwaj et al. 2007; Fink et al. 1988; Petrinec et al. 2000; Snowden & Freyberg 1993). Scattering and fluorescence spectra of solar X-rays by the Earth’s atmospheric gas have been observed during both quiet solar conditions and solar X-ray flares (Petrinec et al. 2000). Alternatively, explanation of Earth’s disk X-ray emissions above 1 keV by the CX mechanism (Carter et al. 2010, 2012) requires the presence of highly charged ions Mg11+, Mg12+, Si13+, and Si14+ in the SW plasma, which should be a very low probable event.
Furthermore, analysis of observed disk X-ray emissions from Jupiter suggests a strong correlation between Jovian disk X-ray emissions and solar X-ray flux (Branduardi-Raymont et al. 2007, 2008). Both the solar and Jovian disk spectra possess similar intensity peaks at energies greater than 1 keV, and evidence indicates that the primary X-ray production mechanism at such energies is scattering of solar X-rays by Jupiter’s disk (Branduardi-Raymont et al. 2007). We therefore theorize that if a similarity in X-ray spectral shapes between cometary and Jovian emissions is observed above 1 keV, cometary emissions above 1 keV may also be a result of SF.
The goal of our research is to develop an accurate theoretical model of SF emissions generated by a cometary atmosphere for different compositions of cometary gas, dust, and ice particles and to calculate its contribution to the observed X-ray intensities over a broad energy range of 0.3−3.0 keV. Our investigation of scattering by dust and ice particles is focused on nano-sized particles as they are efficient X-ray scatterers. Our analysis will determine the contribution of SF to total intensities of cometary X-rays as a function of the photon energies. Comparisons of modeled SF emissions with observational cometary X-ray spectra will indicate if SF is a significant, or possibly even a primary, mechanism for hard X-ray emissions. We will also examine the structural similarities between X-rays emissions from comets and the Jovian disk to explore whether the SF X-ray production mechanism is utilized in comets.
In this article, we report our results of calculations for the spectra and total intensities of the SF X-ray emissions from a cometary atmosphere. Theoretical SF spectra of cometary X-rays are evaluated for average compositions of cometary atmospheres as well as for different size and spatial distributions for dust and ice particles. We discuss details regarding the model’s derivation and an analysis of cometary composition and atmospheric densities in Sect. 2. Results and a comparison to Chandra observations are presented in Sect. 3. We discuss the implications of SF X-ray emissions by cometary dust and ice particles and gas in Sect. 4 and, lastly, summarize our conclusions in Sect. 5.
2. Scattering and fluorescence of solar X-rays by cometary gas, dust, and ice particles
Cometary atmospheres consist of several different atomic and molecular gases and may include a significant fraction of dust and ice nanoparticles. SF properties for a given cometary environment depend on the physical properties of individual scatterers, including their abundances and spatial distributions, as well as the intensity of incident solar photons. This section will define cometary parameters and characteristics of the solar X-ray emission spectra required for detailed formulation of the SF model and outline the model derivation.
2.1. Integrated scattered intensity
We focus our investigations of X-ray scattering and fluorescence on optically thin cometary atmospheres. The description of thin atmospheres does not require consideration of the radiative transfer processes, and cometary SF X-ray fluxes can therefore be computed as a superposition of X-ray fluxes induced by independent single scatterers. The scattered intensity of independent gas or dust and ice particles is derived for photons with energies from 0.3−3.0 keV. Model distributions of gas, dust, and ice particles are then applied to calculate the X-ray flux from the entire cometary atmosphere.
2.1.1. Cross sections of cometary scatterers
Scattering properties for a cometary atmosphere particle are defined by its differential cross section  , which is dependent on scattering angle θsc, incident photon energy ϵ, and, for dust and ice particles, grain radius a. We assume that all dust and ice particles have spherical shapes as this approximation significantly simplifies the theoretical description of X-ray scattering. The scattering cross sections also depend on polarization of incoming electromagnetic radiation. We consider the solar X-ray emission to be unpolarized and use, in our modeling, cross sections averaged over all polarization of solar X-rays. Differential cross sections of the atomic and molecular K-shell absorption, which determine fluorescence production rates, are isotropic and hence have no angular dependence.
Cross sections of elastic photon scattering and fluorescence for all atoms and some molecules have been measured in laboratory experiments and/or been calculated using accurate methods of quantum mechanics and many-body theory. For atomic constituents of the cometary atmosphere, we utilize the database reported in Chantler (1995) and Berger et al. (2010). These databases are known to lack accuracy with energies close to resonance transitions, but averaging of accurate near-resonance structures, such as the results in McLaughlin et al. (2013), over energy step sizes comparable to our selected databases provide good agreement.
Data on scattering of X-rays by cometary dust and ice particles is significantly less developed and is mostly based on empirical models (Rubin et al. 2011; Fink & Rubin 2012). The classical Mie model is used as an approximation in determining differential and total cross sections for nano-sized dust and ice particles (Draine 2003), although differences between the results of Mie and quantum calculations are expected for ultra-small grains. While real cometary nanodust and ice may have extremely complex compositions and geometries, ranging from relatively simple core-mantle structures to large aggregates (Mann 2010), we choose to model the particles as Mie spheres. Such a Mie model assumes a spherical, homogeneous scatterer with uniform index of refraction and is the exact solution to Maxwell’s equations (van de Hulst 1981). Realistic nanoparticles are not spherical and may form much more complex structures, thus requiring more rigorous calculation of classical scattering methods (Draine 2003; Mishchenko et al. 2002), but use of homogenous dust/ice spheres and the Mie model allow for a good approximation of scattering cross sections. The Mie spheres range in radii from 1−10 nm and are composed of carbon, silicon, and H2O ice. The index of refraction used for the nanodust spheres is obtained assuming bulk densities and is dependent on incident photon energy (Henke et al. 1993). Detailed information on scattering cross sections of nanoparticles and relevant atmospheric gases is provided in Fig. 1.
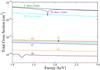 |
Fig. 1 Total cross sections for X-ray scattering of both nano ice and dust as well as neutral hydrogen, helium, carbon, nitrogen, and oxygen gases. |
2.1.2. Morphology of cometary X-ray scattering and fluorescence
In our model, the comet center is located at a distance rc from the Sun and the detector-Sun distance is R0. See Fig. 2 for a diagram of the scattering geometry. The scattered spectral intensity is defined as the number of photons collected per second per unit surface area and per unit interval of the photon energy ϵ. If the solar spectral intensity is known at some specific distance from the Sun, for example at R0 = 1 AU, we can define the observed scattered intensity radiation as seen at the detector Isc(ϵ) in terms of the known solar spectral intensity I0(ϵ). The value of Isc(ϵ) is given by the sum of all photons scattered by cometary atoms, dust, and ice particles.
The spectral intensity Isc(ϵ) of X-rays scattered by the cometary atmosphere is found by integrating over the entire atmospheric volume with the density distribution nj(r) for j types of scatterers:  (1)Equation (1) is valid for optically thin cometary atmospheres, where scattering and absorption of X-rays do not affect the value of the local X-ray photon flux.
Simplification Eq. (1) occurs if the cometary atmosphere’s size is small with respect to distances rc and | rc − R0 |: rj ≪ rc, | rc − R0 |. On average, the radius of the cometary atmosphere r is ~105 − 6 km at 1 AU from the Sun. In comparison to the distances rc and | rc − R0 | that we used in our analysis, the cometary atmosphere is 2−3 orders of magnitude smaller in size. As our analysis is not focused on the morphology of cometary X-ray emissions as a research goal, we may approximate the atmosphere as a point source located at rc and comprised of Nj number of scatterers. Applying this approximation to Eq. (1), we obtain a simple expression for the spectral intensity of scattered X-ray photons:  (2)The resulting equation is an approximation of the scattered X-ray intensity and is a valid approximation in all the cases we investigated.
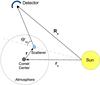 |
Fig. 2 Geometry of a single scatterer within the cometary atmosphere: R0 is the Sun-detector distance, rc is the Sun-comet center distance, r is the comet center-scatterer distance, and |

The derivation of fluorescence emissions is identical to that of scattering, except we are now interested in the intensity ℐmk of a specific spectral line rather than the spectral intensity. The total intensity per fluorescence line k of scatterer m is defined as 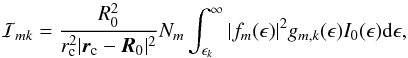 (3)where the intensity spectrum is integrated from the threshold energy ϵk of absorption for the considered fluorescent photon ϵ0k to infinity. As the solar intensity spectrum and photo-absorption cross sections drop off significantly at large ϵ, we truncate the upper bound at 10 keV. The fluorescence intensity is also dependent on the fluorescence yield gm,k(ϵ), the efficiency of many-electron Auger transitions (Krause 1979). Fluorescence yield determines the probability of photon emission by excited many-electron ions. Equations (2) and (3) allow calculation of a complete SF emission spectrum from a cometary atmosphere.
2.2. Composition of cometary atmosphere
Every cometary atmosphere has a unique mixture ratio of atoms, dust, and ice particles, which is a function of the comet-Sun distance and cometary composition. The five recently reported comets whose spectra contain hard X-ray photons above 1 keV have been shown to be primarily composed of H2O, with an average atmospheric contribution of 85% (Biver et al. 2006; Lisse et al. 2005; Christian et al. 2010). Carbon amounts vary between the comets (Biver et al. 2006), averaging to be 10% of the total atmosphere. Nitrogen and silicon are also present in trace amounts, composing less than 5% of the atmosphere.
We normalize the H2O production rate QH2O to observed rates for each comet (Biver et al. 2006; Lisse et al. 2005; Christian et al. 2010). All other element production rates are set equal to the average element-to-H2O composition ratio multiplied by QH2O. We note that because of this normalization method and the overwhelming percentage of H2O in the cometary atmosphere, variations in the mixture ratio of minor elements produce only slight changes to our results. We also choose to exclusively model O-based fluorescence because of the significant proportion of O present within cometary atmospheres in relation to all other elements present.
Cometary dust particles of micron size are efficient scatterers of infrared and optical radiations. Their density is usually considered in analyses of dust-to-gas ratios in atmospheres of different comets. Nano-sized dust and ice particle densities and composition ratios are not as well-established because of a lack of precise observational data for such small masses (Utterback & Kissel 1990). Nanoparticles also efficiently scatter X-rays because their grain geometric sizes are on the same scale as the photon wavelengths (Krasnopolsky et al. 2004; Draine 2003) and are therefore the focus of our scattering calculations. For our model, we infer that dust particles would maintain a similar ratio to those observed for atoms, with 85% H2O, 10% C, and 5% heavier elements like N and Si. Unlike dust particles that can be composed of a variety of elements, ice particles are mostly composed of H2O or CO2. Modeling of ice particles has shown dissociation rates to be dependent on their impurity ratios, where particles with a minimum impurity ratio, known as pure ice particles, possess the longest lifetime (Beer et al. 2006). In our consideration of X-ray scattering by dust and ice nanoparticles, we initially treat all ice particles as pure to establish an upper limit on the particle densities. Should the total scattered contribution of these particles prove significant, we will revise our model to include more accurate impurity distributions.
As observational dust and ice mass production rates within cometary atmospheres are not well-studied, the mass production rate of dust particles qdust is unknown for each of the five comets we analyzed. Instead, the empirically established proportionality for mass loss rates qdust ≃ 1.5qgas is used to estimate the total number of nanoparticles present within the atmosphere (McDonnell et al. 1987; Krasnopolsky 1997; Krasnopolsky et al. 2004). This relationship has previously been shown to be valid for micron-sized dust particles down to 0.1 μm (Fink & Rubin 2012) and is extrapolated down to nanoparticles for our analysis. The extrapolated total nanoparticle mass loss rate agrees with measurements from Utterback & Kissel (1990), but it is possible that nanoparticle distributions may behave independently from micron-sized grains. We therefore use this empirical proportionality for our initial results and then will vary nanoparticle densities as a free parameter when comparing to Chandra data.
2.3. Density distributions
Spatial distribution of the cometary gas, molecules, and dust/ice particles depend on several factors, the most important one being the interaction of the cometary environment with solar radiation and SW. Accurate modeling of a cometary atmosphere requires
-
(a)
a detailed description of the formation of the gas and dust fluxeson the surface of the cometary nucleus;
-
(b)
analysis of important chemical and photo-chemical reactions, as well as dust and ice-particle fragmentation processes;
-
(c)
modeling of the SW plasma interaction with a dusty cometary atmosphere, using advanced MHD models (Häberli et al. 1997) or direct Monte Carlo simulations (Fougere et al. 2013).
Our investigation of cometary X-ray photons is focused on determining spectral intensities, so the X-ray morphology and spatial distributions of the cometary gas and dust can be considered approximately. As a result, we use a simplified model of the distributions of cometary gas and dust, assuming the size of the cometary atmospheres to be much smaller than rc and | rc − R0 |. The density distribution is modeled differently for gas and nanoparticles. The total atomic and molecular gas density n(r), composed of j unique scatterers, is defined with a simple radial distribution (Cravens 1997),  (4)where Qj is the particle production rate for scatterer i, vj is the radial flow velocity of the scatterer, r is the radius from the comet center, and λmj is the mean ionization length for the scatterer.
Distributions n(r) for dust density and dust radius, a, are taken from Fink & Rubin (2012),  (5)where α was set to 2.5 and β was set to 2.0. This distribution agrees with interpolated results extracted from Rubin et al. (2011), although normalization was required. The normalized density distribution nj(r,a) for j dust and ice scatterers is determined to be
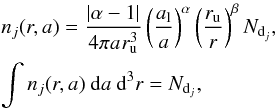 (6)where al is the lower bound for the particle grain radius and ru is the upper bound for the atmosphere radius. Integrating over all grain radii and assuming a simplified model of strictly spherical dust particles, an atmospheric volume for scatterer j equals the total number of dust particle j in the cometary atmosphere Ndj. The total volume density-size distribution of dust and ice particles can be calculated by a summation of Eq. (6) over all types of nanoparticles present within the system: n(r,a) = ∑ jnj(r,a).
2.4. Solar intensity
Spectral composition and intensity of solar X-rays are important for calculating the total SF spectrum of cometary X-ray emission. The CHIANTI atomic database, a theoretical emission line database specifically designed for astrophysical plasmas, is used to model the relative spectral intensities (spectral shape) of the X-ray spectrum from 0.3−3.0 keV (Dere et al. 1997; Landi et al. 2013). The modeled spectrum is compared to observational data from McKenzie et al. (1985) taken from SOLEX-A, and both are in good agreement. Slight discrepancies present are likely a result of fluctuations of solar X-ray line intensities which naturally occur over time (Neupert 2006).
The results from McKenzie et al. (1985) and CHIANTI provide a reliable database from which we can extrapolate a spectral shape, but the solar X-ray spectrum during comet observations is highly dependent on the solar conditions at the time of detection. It is therefore important to determine the real-time solar X-ray intensities during observations and to scale the modeled SF cometary spectra to these values. The GOES X-ray Satellite records total X-ray intensities over the 1.5−15.0 keV range as seen at Earth in three-minute intervals and has data on solar conditions during each cometary observation we are analyzing. By normalizing our model’s spectral intensity to match the average intensity of GOES recorded during the time of observation, we approximate the solar spectral intensity emitted during each cometary observation. The intensity of the solar X-ray flux ℐGOES recorded during each observation is shown in Table 1 together with the observational parameters required for our model.
Model parameters based on Chandra cometary observations and solar spectra data.
3. Results
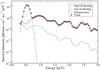 |
Fig. 3 An average X-ray spectrum emitted from a cometary atmosphere as a result of scattering and fluorescence. Our average cometary model was defined with the following parameters: rc = | rc − R0 | = 1 AU, QH2O = 1028 mol s-1, and IGOES = 4 × 10⁵ ph cm-2 s-1. |
Results from our calculations of the SF cometary spectra for the 0.3−3.0 keV range are shown in Fig. 3 for a comet of average atmospheric composition observed during average solar activity. The spectrum illustrates general features of the SF emissions, including a peak at 0.54 keV from the O k-shell fluorescence and peaks from elastic scattering of solar X-ray photons at 1.50 keV (Fe XXII), 1.85 keV (Si XIII), 2.05 keV (Si XIV), 2.45 keV (S XV), 2.60 keV (S XVI), and 2.88 keV (S XV). Intensities of the cometary SF emission at energies below 0.5 keV agree well with intensity estimations reported by Krasnopolsky (1997) and Krasnopolsky et al. (2004). Results on integrated intensity at photon energies above 0.5 keV disagree with those estimations because of an over-estimation of energetic photon intensities in an average solar spectra in Krasnopolsky (1997).
After analysis of the theoretical cometary SF emissions, we return to our initial motivation of determining the mechanism responsible for the peaks observed in the cometary emission spectra above 1 keV. Strong solar flare events could temporarily make the SF mechanism a major source of cometary X-rays and significantly influence high energy comet spectra. Our work is also motivated by our comparison of cometary X-ray emissions to Jovian disk emissions in Fig. 4. As both show similar structure at energies greater than 1 keV, and it is known that Jovian disk X-ray emissions are a result of coherent scattering of solar X-ray flare emissions (Branduardi-Raymont et al. 2007), we explore coherent scattering as a primary production mechanism for comets at energies greater than 1 keV during high solar activity.
Figures 5 and 7 display our theoretical emissions model compared to observational data. Our results show ion lines at 1.50 keV and at 1.85 keV, which are similar to the spectral features seen in a few of the observations, most notably for comet Ikeya-Zhang in the photon energy range between 1−2 keV. However, the spectral intensity magnitudes predicted by the model are significantly less than those observed, leading us to explore the constraints on dust scatterers within the system.
4. Discussion
4.1. Comparison of Ikeya-Zhang to Jovian disk as evidence of scattering above 1 keV in cometary atmospheres
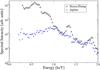 |
Fig. 4 Comparison of X-ray spectra from comet Ikeya-Zhang (Ewing et al. 2013) and Jupiter (Branduardi-Raymont et al. 2007), observed during solar X-ray flares. The data sets have been scaled to overlay each other in order to better visualize the strong similarity in spectral structure between the two astronomical objects at energies above 1 keV. |
Spectral shapes are unique for different X-ray generating processes such as bremsstrahlung, scattering, or SWCX mechanisms. Analysis of the relative spectral shape of detected X-ray signals is broadly used to determine the physical mechanisms responsible for X-ray emission. We therefore compare observed spectral intensity of comet Ikeya-Zhang (IZ) to detections of X-ray scattering from the Jovian disk as evidence of scattering above 1 keV in cometary atmospheres.
Of the comets analyzed, the Chandra observations of IZ are of significant interest because of the high cometary X-ray intensity and pronounced spectral shape. Data on X-ray intensity emissions from GOES taken at the same time as the Chandra observations of IZ show that 2−4 M-class solar flares occurred during this time. The cometary X-ray scattering flux of M-type X-ray solar flares can be 1−3 orders of magnitude higher than the flux observed during quiet solar conditions. In addition, IZ had the highest observed particle production rates of any other comet analyzed (Ewing et al. 2013), providing additional atmospheric scatterers.
Measurements of Jovian X-ray emissions with XMM-Newton have previously been performed during a series of M-class solar flares (Branduardi-Raymont et al. 2007, 2008). Accurate time and spectral correlation between the solar X-ray flares and disk X-ray emission has been analyzed in detail (Branduardi-Raymont et al. 2007), concluding that peaks observed above 1 keV were generated from scattering of solar X-ray photons from Jupiter’s outer atmosphere (Branduardi-Raymont et al. 2007). We can therefore infer a similarity between the production mechanisms within each system, namely scattering of solar X-rays, if we demonstrate a similarity in the general shape and peak structures observed from both the Jovian disk and comet IZ. Above 1 keV there are no significant resonant scattering or absorption cross section features for the primary scatterers present within the cometary and Jovian atmospheres, as shown in Fig. 1. We therefore assert that any similarities of spectral structure, which is defined as a similarity of relative intensities of important spectral features, are independent of atmospheric composition and would exclusively be attributed to relative intensities of the spectral features in the solar X-ray spectra.
Figure 4 shows the relative spectral intensities for Jupiter from XMM overlaid with the comet IZ data taken from Chandra, with both data sets corrected for the differences in effective areas of the two telescopes. The results show a strong similarity in overall spectral shape between the two objects at photon energies above 1 keV. Although each observation was taken during separate solar flares, the peak structures above 1 keV agree with regular features seen in observed solar flare spectra (McKenzie et al. 1985) and are common for average M-class solar flare activity (Dere et al. 1997; Landi et al. 2013).
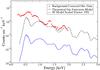 |
Fig. 5 Comparison between the spectral intensities of background-corrected observational data taken from Chandra (×s) and our theorized scattering-fluorescence spectrum model induced exclusively from atmospheric gas (solid line) for Ikeya-Zhang. The dotted-line plot is the model scaled to match the observational intensities. We note the similarity in peak structure at energies greater than 1.5 keV. |
Differences between the IZ and Jupiter spectra near 1.35 keV may be a result of a difference in intensity of the Mg XI (2p−1s) emission line present in the solar flare spectra during the Jupiter and IZ observations. The peak seen in both spectra at 1.85 keV may be a combination of scattered Si XIII (1.85 keV) X-ray emission line from the solar flare and Si K (1.74 keV) fluorescent emission by dust. Spectral differences below 1 keV are explained by the SWCX mechanism of cometary X-rays, which produces additional X-ray photons in the cometary spectrum that the Jovian disk spectrum would lack because it is produced entirely via SF.
As Jupiter disk emissions are shown to be a result of scattering, this strong agreement in spectral shapes above 1 keV leads us to consider that both spectra are produced via the same mechanism, the scattering of solar X-rays. Because both spectra were observed during solar X-ray flares, the similarity of the scattering mechanisms is even more evident.
4.2. Analysis of gas scattering emissions for Ikeya-Zhang
Motivated by our IZ-Jupiter comparison, we analyze the total contribution of gas scattering in the observed IZ spectrum. Figure 5 shows the theoretical spectral intensity of the SF cometary X-rays induced by the atmospheric gas together with the X-ray spectrum observed from comet IZ. We found reasonable agreement in the overall peak structures to our SF model at energies above 1 keV. The largest discrepancy occurs at ~1.35 keV where IZ shows a well-pronounced peak whereas our model does not. This discrepancy may be the result of utilizing an average solar X-ray emission spectrum to model our spectral intensities rather than utilizing direct observations.
Although the spectral shape of the theoretical gas scattering model agrees well with observations of IZ, the total intensity of the predicted SF spectrum above 1 keV is lower than the observed by a factor of ~350. This discrepancy is too great to be accounted for through uncertainties in our calculations or background corrections, and so we conclude that gas scattering of high-energy photons is not a significant source of cometary X-ray emissions given our model parameters.
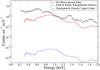 |
Fig. 6 Comparison of total spectral intensity contributions from nanoparticle scattering to observational data of Ikeya-Zhang (×s). The Fink & Rubin (2012) dust distribution represent an average dust density (dashed line), while the upper limit approximation (solid line) represents a hypothetical cometary atmosphere where nanoparticle dust and ice production rates are equal to gas production rates. |
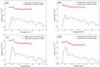 |
Fig. 7 Comparison between the spectral intensities of background-corrected observational data taken from Chandra (×s) and our theorized scattering-fluorescence spectrum model induced entirely from atmospheric gas (solid line) for the following comets: a) 8P, b) Encke, c) LS4, d) MH. |
4.3. Analysis of nanoparticle emissions for Ikeya-Zhang
The presence of additional scatterers in the cometary atmosphere could explain a similarity of spectral shapes of the high-energy cometary emission and solar X-rays. Nevertheless, these particles should be inefficient in scattering of optical and infrared radiation. They should also be inefficient in fluorescence radiation as analysis of observed cometary X-ray emissions have shown that fluorescence from O and several lighter elements are a minor X-ray source in comet emissions less than 1 keV (Krasnopolsky 1997). Nano-sized dust and ice particles would satisfy such conditions (Krasnopolsky 1997). Nanoparticles as additional scatterers could significantly influence the intensity of the high-energy tail for cometary X-ray spectra and should therefore be analyzed in detail.
To investigate the role of nano-sized dust and ice particles, we incorporate the cometary dust density distributions from Fink & Rubin (2012), as discussed in in Sect. 2.3. The comparison of the cometary X-ray emission contribution from nanodust to gas is shown in Fig. 3. Nanoparticle contributions to cometary X-ray emissions are 3−4 orders of magnitude lower than those from gas, indicating that nanoparticles have little impact at these densities on the overall emission spectrum.
As our results shown in Fig. 3 are based on data for dust and ice densities that are extrapolated from micron-sized particles down to nanoparticles, it is possible that nanoparticles, especially small ice particles, are more abundant than predicted by such a scaling technique. For example, the size-distribution density of small particles given by Eq. (5) may sharply increase with an α between 3−5 as particle radii become less than 100 nanometers (Combi et al. 2013; de Val-Borro et al. 2014). At the present time, there are no observations or consistent theories providing robust information on distributions of nano-sized dust and ice particles. We therefore investigate the upper limit of nanoparticle scattering by scaling nanoparticle emissions equal to the observed IZ emissions to extract maximum production rates and densities.
Figure 6 shows the observational data from IZ compared with the Fink & Rubin (2012) model and a maximum nanoparticle density model. Although, the Fink & Rubin (2012) model cannot accurately represent the size distributions of nanoparticles, it may provide a general description of efficiency of X-ray scattering by small ice and dust particles. We note the disparity between the nanoparticle model and the observed spectrum at higher energies. This discrepancy can be attributed to the bias towards smaller scattering angles at higher energies from Mie approximations rather than spectral differences between observational and theoretical data (van de Hulst 1981). The classical Mie model is known to be invalid for the scattering of high-energy photons because the wavelengths of X-ray photons are comparable to the size of dust and ice nanoparticles and therefore the actual geometric shape of the nanoparticles plays an important role.
If the actual complicated geometry of dust and ice nanoparticles were taken into account and a more accurate scattering theory were incorporated, such as quantum mechanical calculations with simplified electronic wave functions of nano-sized grains/particles or classical discrete dipole approximation modeling for aggregate dust particles (Shen et al. 2008), we might obtain the theoretical spectral shape of scattered X-rays that provide a stronger agreement to those observed. However, such calculations are beyond the scope of our investigations.
In addition to the discrepancies with the spectral shape, we note that the required nanoparticle densities to produce such X-ray emissions are significantly higher than the observed density of micron-sized dust and ice particles. For the resulting increase in scattering intensity shown in Fig. 6 to be exclusively from nanoparticles, their mass production rate over a 1−10 nm radii range must be equal to the gas mass-production rate.
Dust production rates can be significantly higher than gas production rates. In the recent observation of the dusty Comet C/2011 L4 (Pan-STARRS) with dust-to-gas mass ratio >4, no gas emission was detected and all observed cometary spectra have been explained by fine-grain water ice and dust particles (Yang et al. 2014). Although it is possible that nanoparticles may be more abundant in the cometary atmosphere than previously theorized, we assert that a more realistic model should treat production of nano-sized particles between 1−10 nm consistently with distributions of larger grains using results of previous observations, such as data from McDonnell et al. (1987).
5. Conclusions
In summary, a strong correlation in spectral shape between X-ray cometary observations and X-ray observations of Jupiter’s disk at energies above 1 keV is found. This correlation indicates that the X-rays of Jupiter and Ikeya-Zhang may have the same emission production mechanism above 1 keV: scattering of solar X-ray flares. This may indicate the presence of additional, previously unaccounted scatterers within cometary atmospheres, such as dust and ice particles. In addition, intensity of the high-energy tail of cometary X-rays above 1 keV may significantly increase during powerful solar X-ray flares.
Scattering and fluorescence of solar X-rays by cometary gas, dust, and ice particles are evaluated over an energy range of 0.3−3.0 keV. The calculations of the gas contribution of cometary emissions are performed with accurate cross sections of X-ray scattering and fluorescence. Theoretical spectra obtained for average solar activity show that the scattering and fluorescence contribution exclusively from cometary gas are 2−3 orders of magnitude lower than observed cometary spectral intensities. These results are in general agreement with previous estimations reported in Krasnopolsky (1997).
Finally, scattering by dust and ice nanoparticles within a cometary atmosphere is evaluated over an energy range of 0.3−2.0 keV. Theoretical spectra obtained with densities derived from observed submicron dust particles show insufficient X-ray scattering contributions to produce observed cometary spectral intensities. Nevertheless, the undetected population of ice and dust nanoparticles with sizes distributed in the range 1−100 nm could produce an intensity of scattered solar energetic photons above 1 keV comparable with observational values if the density of dust and ice nanoparticles is large enough. Comparison of X-ray spectra of Jupiter and cometary emissions indicate that the scattering nature of cometary spectra above 1 keV could be established if a combination of the following is true:
-
(a)
Nano-sized particle production rates in cometaryatmospheres are larger than production rates of micron grains.Presence of nano-sized ice particles could be established byalternative methods.
-
(b)
Implementation of sophisticated dust and ice nanoparticle cross-sections instead of the classical Mie model provides an increase in the total nanoparticle contribution towards cometary scattering above 1 keV.
-
(b)
Total dust and ice scattering contributions from all grain sizes is a significant X-ray emission mechanism.
Of the three possibilities, an investigation of total dust and ice scattering emissions at energies above 1 keV, including nano- and micron-sized particles, is most promising as it, coupled with the results of this article, will provide a comprehensive view on cometary X-ray scattering emissions. This, in addition to observations by current and future X-ray spectrometers such as ASTRO-H, will provide conclusive constraints on major and minor mechanisms of cometary X-ray emissions, determining the significance of scattering and fluorescence within cometary atmospheres at energies above 1 keV. Investigations of X-ray emission spectra of the dusty comets above 1 keV, such as Comet C/2011 L4, may open new opportunities in understanding cometary processes without high-resolution X-ray spectrometers.
Acknowledgments
We would like to thank Anil Bhardwaj and Graziella Branduardi-Raymont for providing their data on the Jovian disk observations and Casey Lisse for fruitful discussions. We also acknowledge National Oceanic and Atmospheric Administration for their GOES X-ray data. The work of V.K. on this project has been supported by NASA (Grant NNX10AB88G).
References
- A’Hearn, M. F., Belton, M. J. S., Delamere, W. A., et al. 2011, Science, 332, 1396 [NASA ADS] [CrossRef] [Google Scholar]
- Beer, E. H., Podolak, M., & Prialnik, D. 2006, Icarus, 180, 473 [NASA ADS] [CrossRef] [Google Scholar]
- Berger, M. J., Hubbell, J. H., Seltzer, S. M., et al. 2010, http://www.nist.gov/pml/data/xcom/ [Google Scholar]
- Bhardwaj, A., Elsner, R. F., Gladstone, G. R., et al. 2007, Planet. Space Sci., 55, 1135 [NASA ADS] [CrossRef] [Google Scholar]
- Biver, N., Bockelée-Morvan, D., Crovisier, J., et al. 2006, A&A, 449, 1255 [NASA ADS] [CrossRef] [EDP Sciences] [Google Scholar]
- Bochsler, P. 2007, A&ARv, 14, 1 [NASA ADS] [CrossRef] [Google Scholar]
- Bodewits, D., Christian, D. J., Torney, M., et al. 2007, A&A, 469, 1183 [NASA ADS] [CrossRef] [EDP Sciences] [Google Scholar]
- Branduardi-Raymont, G., Bhardwaj, A., Elsner, R. F., et al. 2007, Planet. Space Sci., 55, 1126 [NASA ADS] [CrossRef] [Google Scholar]
- Branduardi-Raymont, G., Elsner, R. F., Galand, M., et al. 2008, J. Geophys. Res: Space Physics, 113 [Google Scholar]
- Carter, J., Sembay, S., & Read, A. 2010, MNRAS, 402, 867 [NASA ADS] [CrossRef] [Google Scholar]
- Carter, J., Sembay, S., & Read, A. 2012, Astron. Nachr., 333, 313 [NASA ADS] [CrossRef] [Google Scholar]
- Chantler, C. T. 1995, J. Phys. Chem. Ref. Data, 24, 71 [NASA ADS] [CrossRef] [Google Scholar]
- Christian, D. J., Bodewits, D., Lisse, C. M., et al. 2010, ApJS, 187, 447 [NASA ADS] [CrossRef] [Google Scholar]
- Combi, M., Mäkinen, J., Bertaux, J.-L., et al. 2013, Icarus, 225, 740 [NASA ADS] [CrossRef] [Google Scholar]
- Cravens, T. E. 1997, Geophys. Res. Lett., 24, 105 [NASA ADS] [CrossRef] [Google Scholar]
- de Val-Borro, M., Bockelée-Morvan, D., Jehin, E., et al. 2014, A&A, 564, A124 [NASA ADS] [CrossRef] [EDP Sciences] [Google Scholar]
- Dere, K. P., Landi, E., Mason, H. E., Fossi, B. C. M., & Young, P. R. 1997, A&AS, 125, 149 [NASA ADS] [CrossRef] [EDP Sciences] [Google Scholar]
- Draine, B. T. 2003, ApJ, 598, 1026 [NASA ADS] [CrossRef] [Google Scholar]
- Ewing, I., Christian, D. J., Bodewits, D., et al. 2013, ApJ, 763, 66 [NASA ADS] [CrossRef] [Google Scholar]
- Fink, U., & Rubin, M. 2012, Icarus, 221, 721 [NASA ADS] [CrossRef] [Google Scholar]
- Fink, H., Schmitt, J., & Jr., F. H. 1988, A&A, 193, 345 [Google Scholar]
- Fougere, N., Combi, M. R., Rubin, M., & Tenishev, V. 2013, Icarus, 225, 688 [NASA ADS] [CrossRef] [Google Scholar]
- Häberli, R. M., Gombosi, T. I., Zeeuw, D. L. D., Combi, M. R., & Powell, K. G. 1997, Science, 276, 939 [NASA ADS] [CrossRef] [Google Scholar]
- Henke, B. L., Gullikson, E. M., & Davis, J. C. 1993, At. Data. Nucl. Data Tables, 54, 181 [Google Scholar]
- Kharchenko, V., Rigazio, M., Dalgarno, A., & Krasnopolsky, V. A. 2003, ApJ, 585, L73 [NASA ADS] [CrossRef] [Google Scholar]
- Krasnopolsky, V. A. 1997, Icarus, 128, 368 [NASA ADS] [CrossRef] [Google Scholar]
- Krasnopolsky, V. A., Greenwood, J. B., & Stancil, P. C. 2004, Space Sci. Rev., 113, 271 [NASA ADS] [CrossRef] [Google Scholar]
- Krause, M. O. 1979, J. Phys. Chem. Ref. Data, 8, 307 [NASA ADS] [CrossRef] [Google Scholar]
- Landi, E., Young, P. R., Dere, K. P., Zanna, G. D., & Mason, H. E. 2013, ApJ, 763, 86 [NASA ADS] [CrossRef] [Google Scholar]
- Lepri, S. T., Landi, E., & Zurbuchen, T. H. 2013, ApJ, 768, 94 [NASA ADS] [CrossRef] [Google Scholar]
- Lisse, C. M., Christian, D. J., Dennerl, K., et al. 2001, Science, 292, 1343 [NASA ADS] [CrossRef] [PubMed] [Google Scholar]
- Lisse, C. M., Cravens, T. E., & Dennerl, K. 2004, in Comets II, eds. M. Festou, H. U. Keller, & H. A. Weaver (Tucson: The University of Arizona Press), 631 [Google Scholar]
- Lisse, C. M., Christian, D. J., Dennerl, K., et al. 2005, ApJ, 635, 1329 [NASA ADS] [CrossRef] [Google Scholar]
- Mann, I. 2010, ARA&A, 48, 173 [Google Scholar]
- McDonnell, J., Alexander, W., Burton, W., et al. 1987, A&A, 187, 719 [NASA ADS] [Google Scholar]
- McKenzie, D. L., Landecker, P. B., Feldman, U., & Doschek, G. A. 1985, ApJ, 289, 849 [NASA ADS] [CrossRef] [Google Scholar]
- McLaughlin, B. M., Ballance, C. P., Bowen, K. P., Gardenghi, D. J., & Stolte, W. C. 2013, ApJ, 771, L8 [NASA ADS] [CrossRef] [Google Scholar]
- Mishchenko, M. I., Travis, L. D., & Lacis, A. A. 2002, Scattering, Absorption and Emission of Light by Small Particles (Cambridge: Cambridge University Press) [Google Scholar]
- Neupert, W. M. 2006, Adv. Space Res., 37, 238 [NASA ADS] [CrossRef] [Google Scholar]
- Petrinec, S., McKenzie, D., Imhof, W., Mobilia, J., & Chenette, D. 2000, J Atmos. Sol. Terr. Phys., 62, 875 [NASA ADS] [CrossRef] [Google Scholar]
- Rubin, M., Tenishev, V. M., Combi, M. R., et al. 2011, Icarus, 213, 655 [NASA ADS] [CrossRef] [Google Scholar]
- Shen, Y., Draine, B. T., & Johnson, E. T. 2008, ApJ, 689, 260 [NASA ADS] [CrossRef] [Google Scholar]
- Snowden, S., & Freyberg, M. 1993, ApJ, 404, 403 [NASA ADS] [CrossRef] [Google Scholar]
- Utterback, N. G., & Kissel, J. 1990, AJ, 100, 1315 [NASA ADS] [CrossRef] [Google Scholar]
- van de Hulst, H. C. 1981, Light Scattering by Small Particles (New York: Courier Dover Publications) [Google Scholar]
- von Steiger, R., Schwadron, N. A., Fisk, L. A., et al. 2000, J. Geophys. Res, 105, 27217 [Google Scholar]
- Yang, B., Keane, J., Meech, K., Owen, T., & Wainscoat, R. 2014, ApJ, 784, L23 [NASA ADS] [CrossRef] [Google Scholar]
All Tables
All Figures
|
Fig. 1 Total cross sections for X-ray scattering of both nano ice and dust as well as neutral hydrogen, helium, carbon, nitrogen, and oxygen gases. |
| In the text | |
|
Fig. 2 Geometry of a single scatterer within the cometary atmosphere: R0 is the Sun-detector distance, rc is the Sun-comet center distance, r is the comet center-scatterer distance, and |
| In the text | |
|
Fig. 3 An average X-ray spectrum emitted from a cometary atmosphere as a result of scattering and fluorescence. Our average cometary model was defined with the following parameters: rc = | rc − R0 | = 1 AU, QH2O = 1028 mol s-1, and IGOES = 4 × 10⁵ ph cm-2 s-1. |
| In the text | |
|
Fig. 4 Comparison of X-ray spectra from comet Ikeya-Zhang (Ewing et al. 2013) and Jupiter (Branduardi-Raymont et al. 2007), observed during solar X-ray flares. The data sets have been scaled to overlay each other in order to better visualize the strong similarity in spectral structure between the two astronomical objects at energies above 1 keV. |
| In the text | |
|
Fig. 5 Comparison between the spectral intensities of background-corrected observational data taken from Chandra (×s) and our theorized scattering-fluorescence spectrum model induced exclusively from atmospheric gas (solid line) for Ikeya-Zhang. The dotted-line plot is the model scaled to match the observational intensities. We note the similarity in peak structure at energies greater than 1.5 keV. |
| In the text | |
|
Fig. 6 Comparison of total spectral intensity contributions from nanoparticle scattering to observational data of Ikeya-Zhang (×s). The Fink & Rubin (2012) dust distribution represent an average dust density (dashed line), while the upper limit approximation (solid line) represents a hypothetical cometary atmosphere where nanoparticle dust and ice production rates are equal to gas production rates. |
| In the text | |
|
Fig. 7 Comparison between the spectral intensities of background-corrected observational data taken from Chandra (×s) and our theorized scattering-fluorescence spectrum model induced entirely from atmospheric gas (solid line) for the following comets: a) 8P, b) Encke, c) LS4, d) MH. |
| In the text | |
Current usage metrics show cumulative count of Article Views (full-text article views including HTML views, PDF and ePub downloads, according to the available data) and Abstracts Views on Vision4Press platform.
Data correspond to usage on the plateform after 2015. The current usage metrics is available 48-96 hours after online publication and is updated daily on week days.
Initial download of the metrics may take a while.