Fig. 5
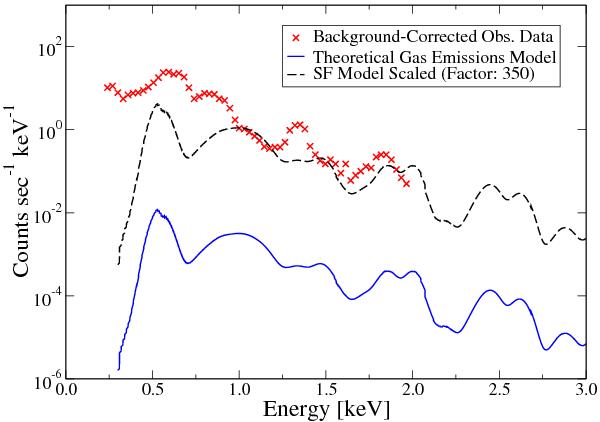
Comparison between the spectral intensities of background-corrected observational data taken from Chandra (×s) and our theorized scattering-fluorescence spectrum model induced exclusively from atmospheric gas (solid line) for Ikeya-Zhang. The dotted-line plot is the model scaled to match the observational intensities. We note the similarity in peak structure at energies greater than 1.5 keV.
Current usage metrics show cumulative count of Article Views (full-text article views including HTML views, PDF and ePub downloads, according to the available data) and Abstracts Views on Vision4Press platform.
Data correspond to usage on the plateform after 2015. The current usage metrics is available 48-96 hours after online publication and is updated daily on week days.
Initial download of the metrics may take a while.