Fig. 1
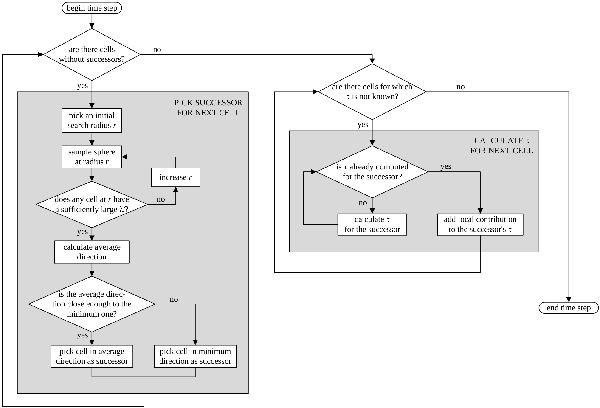
Flow chart of the MODA algorithm. This schematic representation of MODA reveals two distinct steps (the choice of successors and the integration of τ), each of which involves a loop over all grid points (or cells). The algorithm is completely described by this chart, and all specific decisions that are not included in the figure (e.g., how to pick the initial r and how much to successively increase it afterwards) are parametrizations that depend on the underlying implementation (i.e., grid-based or tree-based).
Current usage metrics show cumulative count of Article Views (full-text article views including HTML views, PDF and ePub downloads, according to the available data) and Abstracts Views on Vision4Press platform.
Data correspond to usage on the plateform after 2015. The current usage metrics is available 48-96 hours after online publication and is updated daily on week days.
Initial download of the metrics may take a while.