Fig. 5
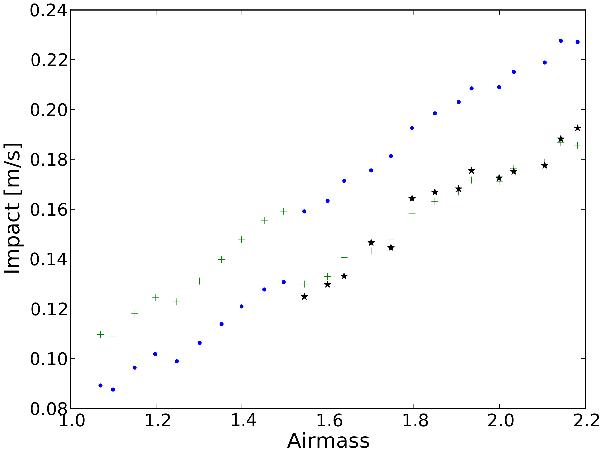
Impact of the atmosphere in the RVs for 18 Sco for different values of airmass. All the spectra were taken during the night of 2012/05/19. The blue dots represent the impact calculated using the default TAPAS spectra, the green crosses (+) in the left part of the plot represent the impact using the TAPAS spectra for the time corresponding to spectra with airmass 1.55, and green + crosses in the right part the impact using the TAPAS spectra for the hour corresponding to spectra with airmass 1.5. The black stars represent the impact using adjusted H2O transmission spectra.
Current usage metrics show cumulative count of Article Views (full-text article views including HTML views, PDF and ePub downloads, according to the available data) and Abstracts Views on Vision4Press platform.
Data correspond to usage on the plateform after 2015. The current usage metrics is available 48-96 hours after online publication and is updated daily on week days.
Initial download of the metrics may take a while.