Fig. 9
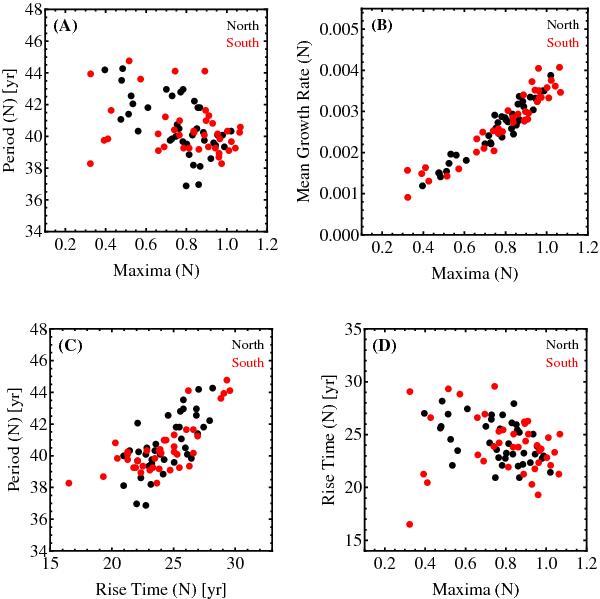
Waldmeier-type relationships for the magnetic proxies built from the millennium simulation. A) Period vs. Maxima; B) Mean Growth Rate vs. Maxima; C) Period vs. Rise Time; and D) Rise Time vs. Maxima. The similar anticorrelation observed in Period vs. Maxima (in A)) and Rise Time vs. Maxima (in D)) is a consequence of the good correlation between Period and Rise Time (in C)).
Current usage metrics show cumulative count of Article Views (full-text article views including HTML views, PDF and ePub downloads, according to the available data) and Abstracts Views on Vision4Press platform.
Data correspond to usage on the plateform after 2015. The current usage metrics is available 48-96 hours after online publication and is updated daily on week days.
Initial download of the metrics may take a while.