Free Access
Fig. 12
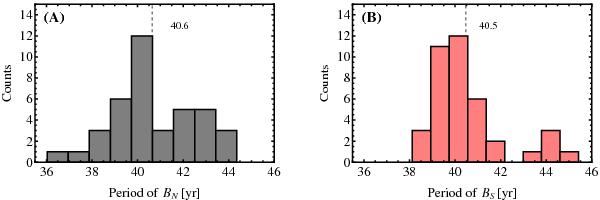
Histograms for the periods measured in the A) north and B) south hemispheres. Signs of bimodality are apparent again here, although not as well-defined in the northern hemisphere as in the south. However, these subgroups of long-period cycles do not map onto the subgroups of low-amplitude cycles in Fig. 10 (see text).
Current usage metrics show cumulative count of Article Views (full-text article views including HTML views, PDF and ePub downloads, according to the available data) and Abstracts Views on Vision4Press platform.
Data correspond to usage on the plateform after 2015. The current usage metrics is available 48-96 hours after online publication and is updated daily on week days.
Initial download of the metrics may take a while.