Free Access
Fig. 6
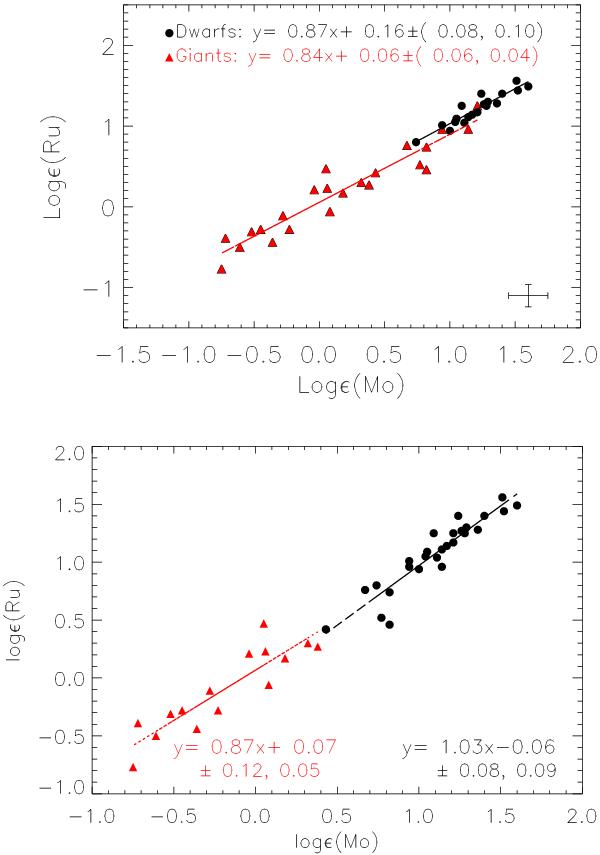
Top: weak correlation between Mo and Ru. Dwarfs (filled black circles) and giants (filled red triangles) with fitted lines plotted on top. Bottom: linear trends fitted to Mo and Ru abundances in the automatically assigned clusters. Red points are generally more metal-poor than black points.
Current usage metrics show cumulative count of Article Views (full-text article views including HTML views, PDF and ePub downloads, according to the available data) and Abstracts Views on Vision4Press platform.
Data correspond to usage on the plateform after 2015. The current usage metrics is available 48-96 hours after online publication and is updated daily on week days.
Initial download of the metrics may take a while.