Fig. 4
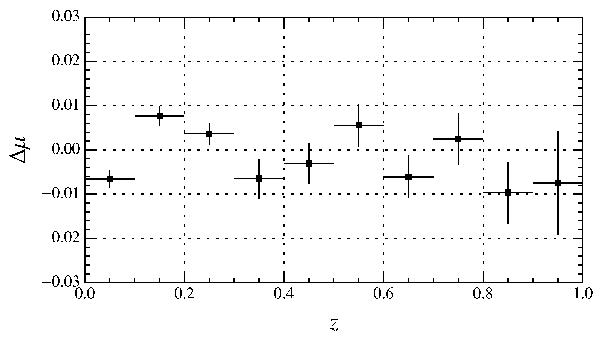
Bias in reconstructed distance modulus as a function of redshift. Simulations follow the color variation model described in Scolnic et al. (2014, Sect. 3.1). The simulated sample includes low-z, SDSS-II and SNLS SNe Ia and is representative of our JLA sample described in Sect. 5.1. The analysis of the simulated sample includes the bias correction described in Sect. 5.3 (computed under the baseline SALT2 assumptions). The SALT2 model was not retrained on the simulated sample, similarly to what is done in Kessler et al. (2013).
Current usage metrics show cumulative count of Article Views (full-text article views including HTML views, PDF and ePub downloads, according to the available data) and Abstracts Views on Vision4Press platform.
Data correspond to usage on the plateform after 2015. The current usage metrics is available 48-96 hours after online publication and is updated daily on week days.
Initial download of the metrics may take a while.