Fig. 2
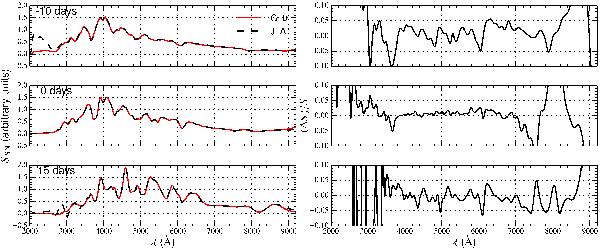
Comparison of ℳ0 templates between the previous release of the SALT2 model (G10) and the present release trained on the JLA sample. Left: the present model is shown as a black dashed line at three different phases: early (−10 days), close to maximum (0 day), and late (+15 days). The G10 model is shown as the red solid line. Right: relative differences in the two models (JLA/G10 − 1) at the three selected phases.
Current usage metrics show cumulative count of Article Views (full-text article views including HTML views, PDF and ePub downloads, according to the available data) and Abstracts Views on Vision4Press platform.
Data correspond to usage on the plateform after 2015. The current usage metrics is available 48-96 hours after online publication and is updated daily on week days.
Initial download of the metrics may take a while.