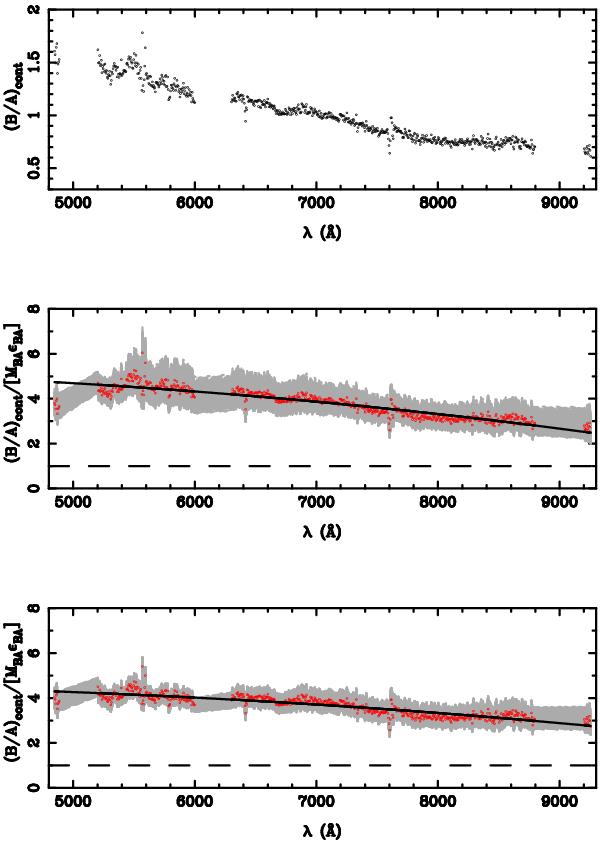
Fig. 8

Continuum flux ratio and microlensing signal. Top panel: continuum flux ratio. Middle panel: microlensing magnification ratio using the best fit (red circles) and the 1σ band (light grey region) for Galactic extinction. Bottom panel: microlensing magnification ratio using the best fit (red circles) and the 1σ band (light grey region) for quadratic extinction. In the middle and bottom panels, the microlensing signal from the 1σ bands is linearly interpolated in the spectral regions where the C iv, C iii] and Mg ii emission lines appear. We also show the zero-level for microlensing (dashed lines; μBA = 1) and fits to a simple microlensing model (solid lines; see main text).
Current usage metrics show cumulative count of Article Views (full-text article views including HTML views, PDF and ePub downloads, according to the available data) and Abstracts Views on Vision4Press platform.
Data correspond to usage on the plateform after 2015. The current usage metrics is available 48-96 hours after online publication and is updated daily on week days.
Initial download of the metrics may take a while.


