Open Access
Fig. 7
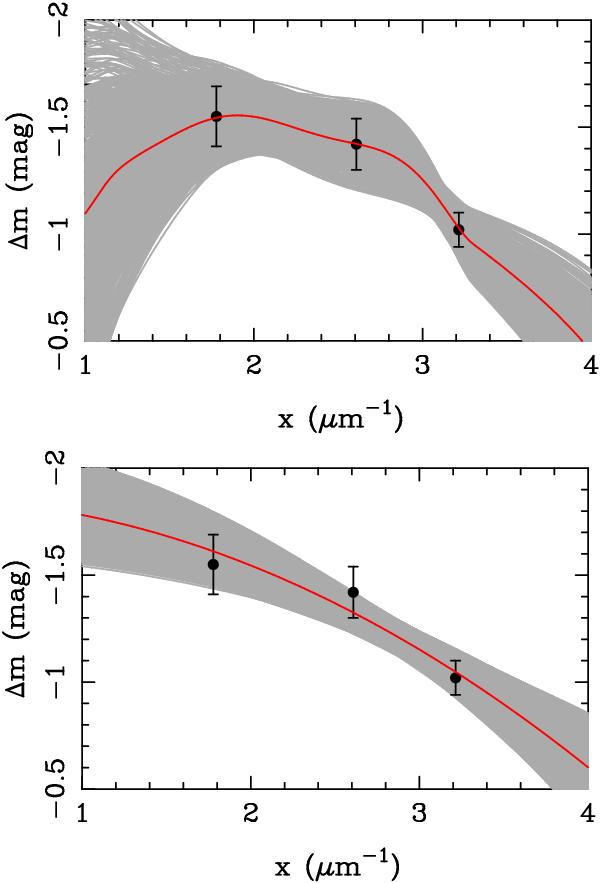
Extinction curve for SDSS J1339+1310. Filled circles with error bars represent the line-core magnitude differences in Table 2. The red lines describe the best fits, and the light grey areas are the 1σ bands. Top panel: galactic extinction. Bottom panel: quadratic extinction (see main text).
Current usage metrics show cumulative count of Article Views (full-text article views including HTML views, PDF and ePub downloads, according to the available data) and Abstracts Views on Vision4Press platform.
Data correspond to usage on the plateform after 2015. The current usage metrics is available 48-96 hours after online publication and is updated daily on week days.
Initial download of the metrics may take a while.