Fig. 4
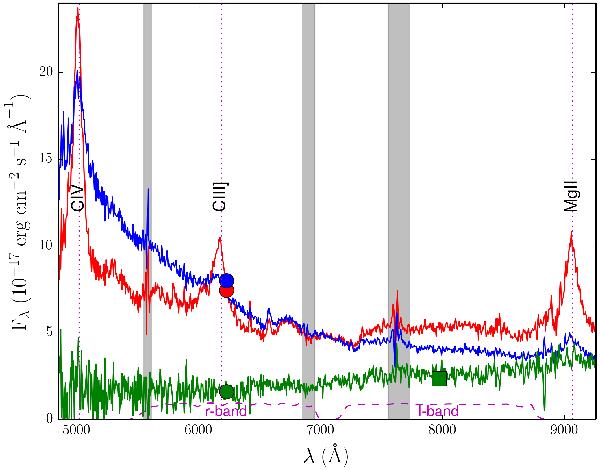
GTC-OSIRIS spectra of SDSS J1339+1310. These are derived from a 2.7 ks exposure on 13 April 2013. The red, blue, and green lines trace the fluxes of A, B, and G (see Fig. 2) as a function of observed wavelength. Data from frames in the r (circles) and I (square) bands are also shown for comparison purposes. The dashed lines describe the responses of the two filters, i.e., the LT r-Sloan and the NOT #12 passbands. Vertical dotted lines are associated with emission lines at zs = 2.24, while grey highlighted regions indicate atmospheric artefacts (see main text).
Current usage metrics show cumulative count of Article Views (full-text article views including HTML views, PDF and ePub downloads, according to the available data) and Abstracts Views on Vision4Press platform.
Data correspond to usage on the plateform after 2015. The current usage metrics is available 48-96 hours after online publication and is updated daily on week days.
Initial download of the metrics may take a while.