Fig. 1
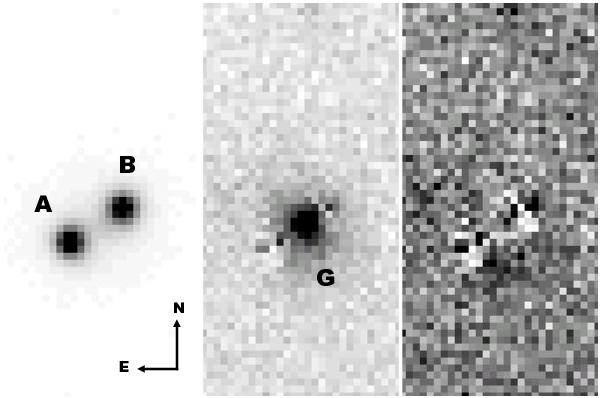
Stacked frame of SDSS J1339+1310 with the NOT in the I band. This corresponds to exposures taken with ALFOSC on 13 June 2010 (total exposure time = 3.6 ks, seeing = 0.̋64). In addition to the original signal (left panel), we also consider a model that includes four additive ingredients: two PSFs (quasar images), the convolution of a 2D de Vaucouleurs profile and the PSF (lensing galaxy), and a constant term (sky background). We display the residual fluxes after subtracting only the quasar images and the background (middle panel), as well as the residual signal after subtracting the global model (right panel). The fit to the model is made with IMFITFITS software (see main text).
Current usage metrics show cumulative count of Article Views (full-text article views including HTML views, PDF and ePub downloads, according to the available data) and Abstracts Views on Vision4Press platform.
Data correspond to usage on the plateform after 2015. The current usage metrics is available 48-96 hours after online publication and is updated daily on week days.
Initial download of the metrics may take a while.