Fig. 6
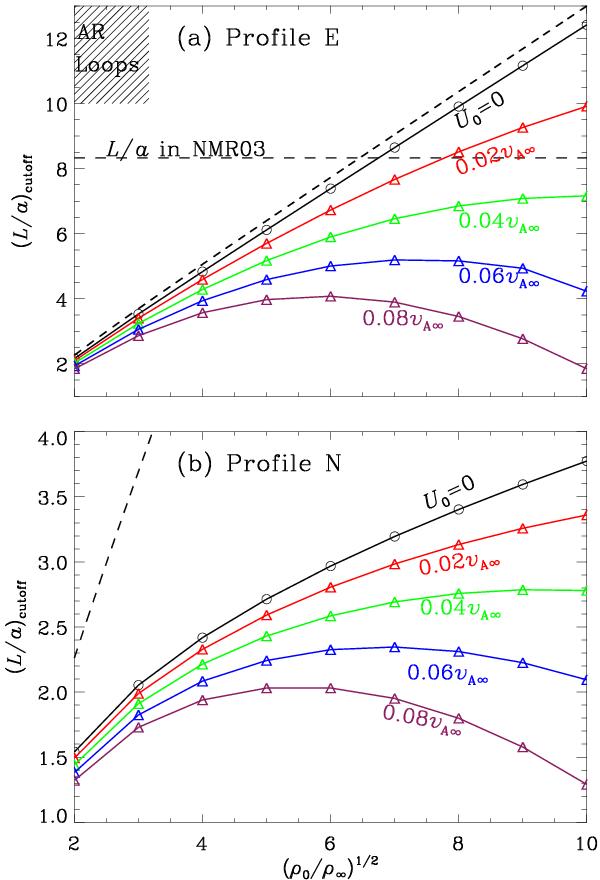
Dependence on density contrast ρ0/ρ∞ of threshold length-to-radius ratio (L/a)cutoff below which standing sausage modes are trapped. Both a) profile E and b) profile N are examined. The solid black curves are for the static case, while the colored curves represent the non-static cases with the flow magnitude U0 ranging from 0.02 vA∞ to 0.08 vA∞. In the computations, both the density and flow profile steepness, p and u, are taken to be 2. The dashed straight lines in both panels represent the threshold length-to-radius ratio analytically derived in the static case for a step-function profile (Eq. (4)). Furthermore, the hatched area corresponds to the parameter range for typical active region (AR) loops. The horizontal dashed line represents the length-to-radius ratio of the flaring loop reported in Nakariakov et al. (2003).
Current usage metrics show cumulative count of Article Views (full-text article views including HTML views, PDF and ePub downloads, according to the available data) and Abstracts Views on Vision4Press platform.
Data correspond to usage on the plateform after 2015. The current usage metrics is available 48-96 hours after online publication and is updated daily on week days.
Initial download of the metrics may take a while.