Fig. 5
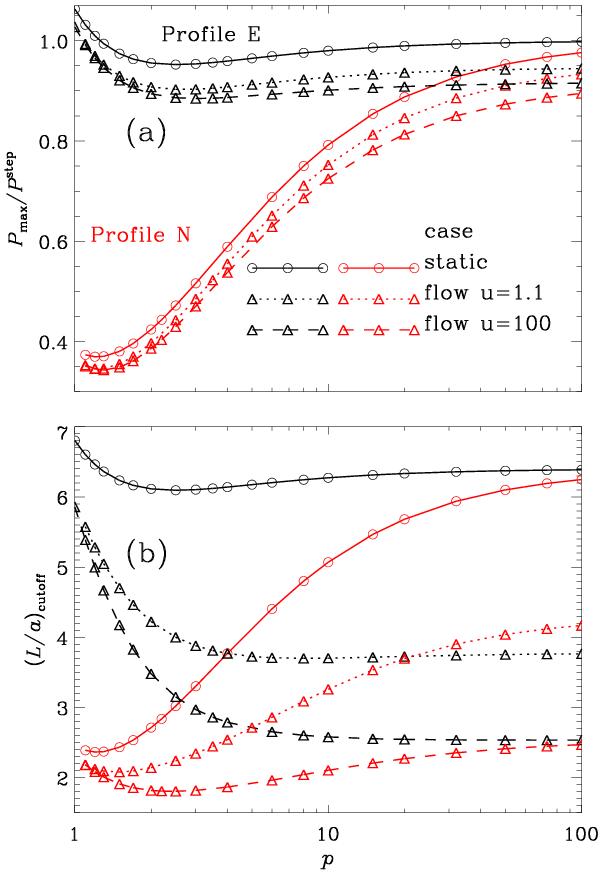
Dependence on density profile steepness p of a) the maximum sausage period Pmax and b) the threshold length-to-radius ratio (L/a)cutoff. The black (red) curves are for loops described by profile E (N). A density contrast of 25 is adopted. The solid curves corresponds to the static case (flow magnitude U0 = 0), while the dotted and dashed lines correspond to the cases with flow where the flow profile steepness u is 1.1 and 100, respectively. In the cases with flow, U0 is fixed at 0.08 vA∞.
Current usage metrics show cumulative count of Article Views (full-text article views including HTML views, PDF and ePub downloads, according to the available data) and Abstracts Views on Vision4Press platform.
Data correspond to usage on the plateform after 2015. The current usage metrics is available 48-96 hours after online publication and is updated daily on week days.
Initial download of the metrics may take a while.