Fig. 4
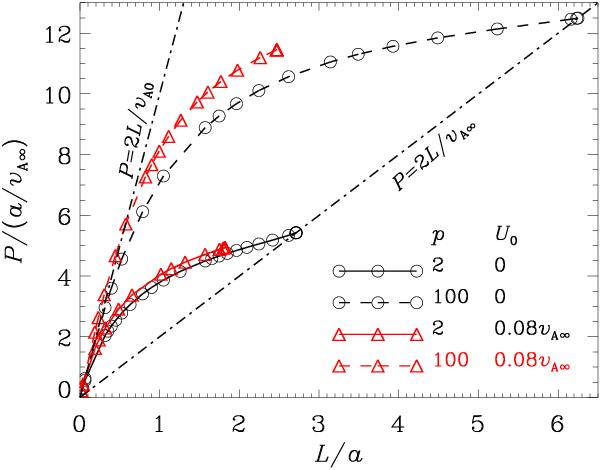
Sausage mode period P as a function of loop length measured in units of loop radius for a loop described by profile N. The black and red curves are for the static case (flow magnitude U0 = 0) and a case with flow (U0 = 0.08 vA∞ with steepness u = 100), respectively. A density contrast of 25 is adopted. However, two values of density steepness p are examined, and given by the solid (p = 2) and dashed (p = 100) curves, respectively. The two dash-dotted lines represent the two limiting cases for static loops where the phase speed equals either the internal or the external Alfvén speed.
Current usage metrics show cumulative count of Article Views (full-text article views including HTML views, PDF and ePub downloads, according to the available data) and Abstracts Views on Vision4Press platform.
Data correspond to usage on the plateform after 2015. The current usage metrics is available 48-96 hours after online publication and is updated daily on week days.
Initial download of the metrics may take a while.