Fig. 3
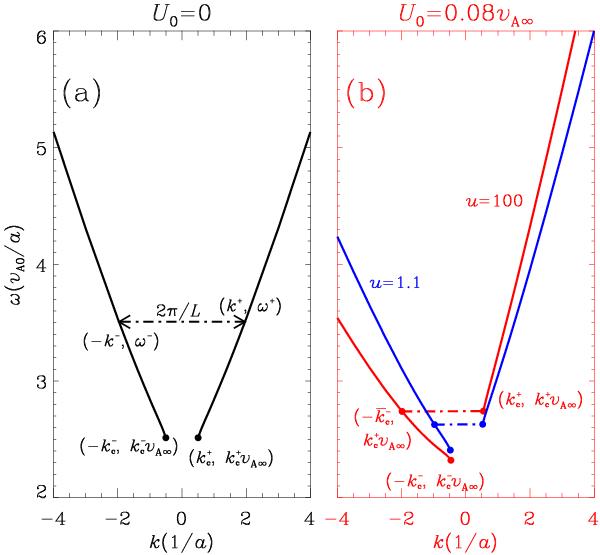
Dependence of angular frequency ω on axial wavenumber k for both a) a static loop and b) a loop with flow. The numerical results found in Fig. 2 are adopted. The ω–k curve in the first (second) quadrant derives from the curve in the first (fourth) quadrant of Fig. 2. In panel b), the blue curves correspond to the case with a different flow profile steepness, u = 1.1.
Current usage metrics show cumulative count of Article Views (full-text article views including HTML views, PDF and ePub downloads, according to the available data) and Abstracts Views on Vision4Press platform.
Data correspond to usage on the plateform after 2015. The current usage metrics is available 48-96 hours after online publication and is updated daily on week days.
Initial download of the metrics may take a while.