Fig. 2
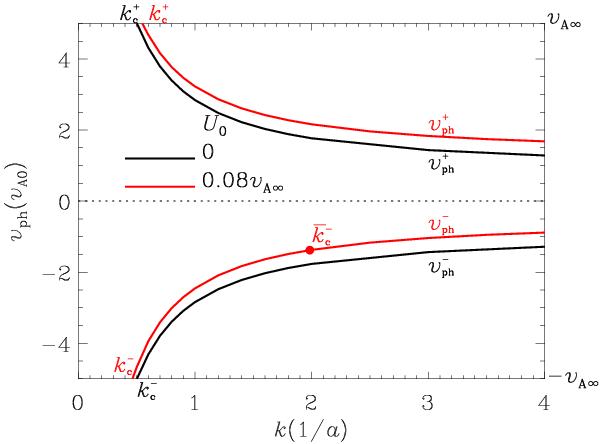
Axial phase speed vph as a function of longitudinal
wavenumber k for a loop with profile N. The black and red
curves correspond to the static case (U0 = 0) and a case with flow
(U0 = 0.08
vA∞ and u = 100), respectively.
Here for the density parameters, a contrast of 25 and a steepness p = 100 are chosen. The
horizontal dotted line corresponds to vph = 0. The curves in the first
(fourth) quadrant are labeled  (
( ). The
rest of the symbols represent the wavenumber cutoffs (please see text for
details).
). The
rest of the symbols represent the wavenumber cutoffs (please see text for
details).
Current usage metrics show cumulative count of Article Views (full-text article views including HTML views, PDF and ePub downloads, according to the available data) and Abstracts Views on Vision4Press platform.
Data correspond to usage on the plateform after 2015. The current usage metrics is available 48-96 hours after online publication and is updated daily on week days.
Initial download of the metrics may take a while.