Fig. 1
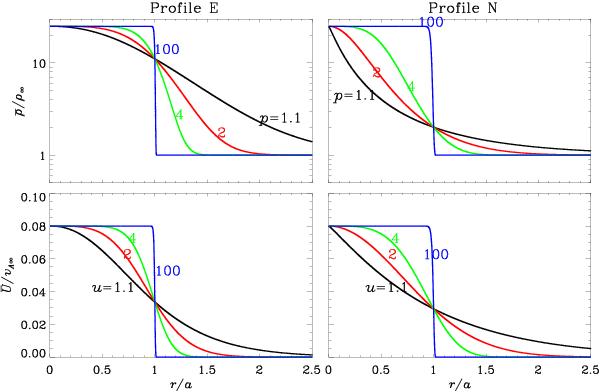
Background density  and flow speed
  as a function of radial distance from loop axis. Two profiles are distinguished: one
designated E (left column) and described by Eq. (1), the other designated N
(right) and described by Eq. (2). A series of values for the density profile steepness
p and
flow profile steepness u is examined and given by different colors as
denoted. For illustration, we choose a density contrast of ρ0/ρ∞ =
25 and a flow magnitude of U0 = 0.08
vA∞, where vA∞
represents the Alfvén speed at large distances.
as a function of radial distance from loop axis. Two profiles are distinguished: one
designated E (left column) and described by Eq. (1), the other designated N
(right) and described by Eq. (2). A series of values for the density profile steepness
p and
flow profile steepness u is examined and given by different colors as
denoted. For illustration, we choose a density contrast of ρ0/ρ∞ =
25 and a flow magnitude of U0 = 0.08
vA∞, where vA∞
represents the Alfvén speed at large distances.
Current usage metrics show cumulative count of Article Views (full-text article views including HTML views, PDF and ePub downloads, according to the available data) and Abstracts Views on Vision4Press platform.
Data correspond to usage on the plateform after 2015. The current usage metrics is available 48-96 hours after online publication and is updated daily on week days.
Initial download of the metrics may take a while.