Fig. 15
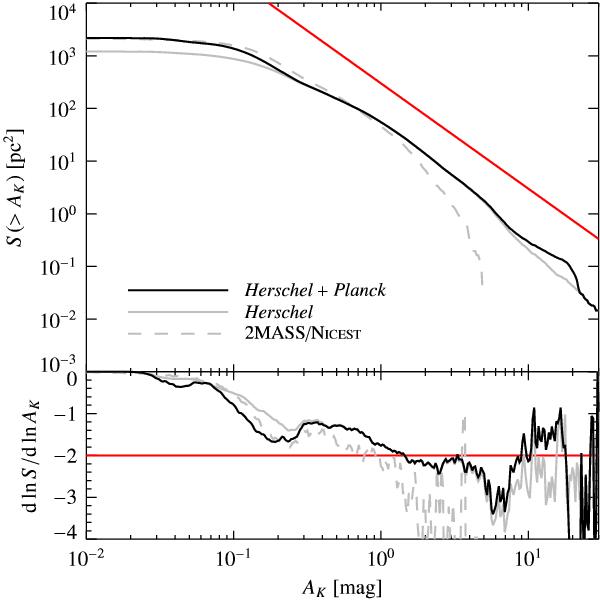
Integral area-extinction relation for Orion A, i.e., the physical cloud area above a given extinction threshold (top panel), and the logarithmic derivative of this quantity (bottom panel). The solid black line shows the result for the entire field, while the solid gray line shows the region covered by Herschel alone. For comparison we also plot as a dashed gray line the same quantity as obtained from the 2MASS/Nicest extinction map and a simple S( > relation as a red line.
Current usage metrics show cumulative count of Article Views (full-text article views including HTML views, PDF and ePub downloads, according to the available data) and Abstracts Views on Vision4Press platform.
Data correspond to usage on the plateform after 2015. The current usage metrics is available 48-96 hours after online publication and is updated daily on week days.
Initial download of the metrics may take a while.