Fig. 9
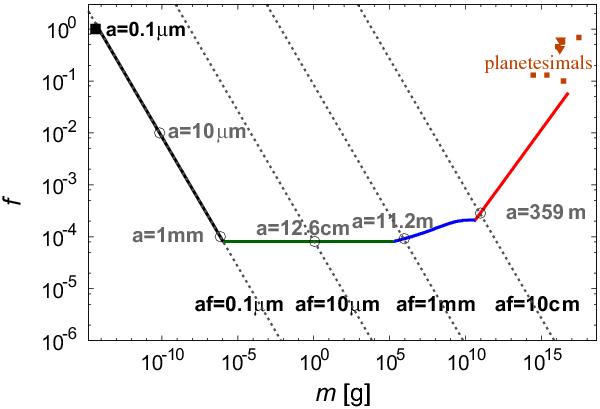
Internal density evolution at r = 30 AU in the minimum mass solar nebula model (see Kataoka et al. 2013b, for more details). The solid line represents the evolution. The black, green, blue, and red lines are in the coagulation phase of hit-and-stick, collisional compression, gas compression, and self-gravitational compression, respectively. The dotted lines show the af = (constant) lines, where af = 0.1 μm, 10 μm, 1 mm, and 10 cm, respectively.
Current usage metrics show cumulative count of Article Views (full-text article views including HTML views, PDF and ePub downloads, according to the available data) and Abstracts Views on Vision4Press platform.
Data correspond to usage on the plateform after 2015. The current usage metrics is available 48-96 hours after online publication and is updated daily on week days.
Initial download of the metrics may take a while.