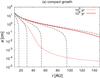
Fig. 12
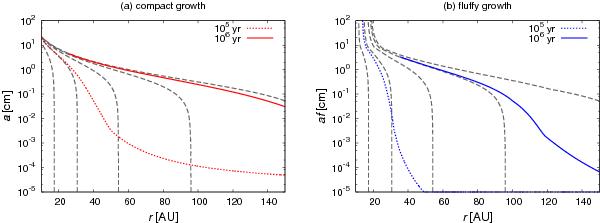
Paths of the growth and drift of dust aggregates at each initial orbital radius (dashed gray lines). Radial size distribution of dust aggregates at the specific time (solid and dotted lines). a) Compact case, where the red dotted line shows the isochrone at t = 105 years and the solid red line shows at t = 106 years. b) Fluffy growth case, where the dotted blue line shows the isochrone at t = 105 years and the solid blue line at t = 106 years.
Current usage metrics show cumulative count of Article Views (full-text article views including HTML views, PDF and ePub downloads, according to the available data) and Abstracts Views on Vision4Press platform.
Data correspond to usage on the plateform after 2015. The current usage metrics is available 48-96 hours after online publication and is updated daily on week days.
Initial download of the metrics may take a while.