Fig. 11
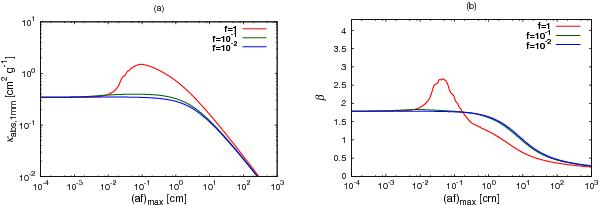
a) Absorption mass opacity at λ = 1mm against (af)max. The red, green, and blue lines show the cases of f = 1,10-1, and 10-2. The lines in the cases of f< 10-2 are indistinguishable from the line of f = 10-2. The aggregate size distribution is assumed to be n ∝ (af)-2 where f is fixed in each case. b) Opacity slope β between 1 mm and 3 mm, against (af)max.
Current usage metrics show cumulative count of Article Views (full-text article views including HTML views, PDF and ePub downloads, according to the available data) and Abstracts Views on Vision4Press platform.
Data correspond to usage on the plateform after 2015. The current usage metrics is available 48-96 hours after online publication and is updated daily on week days.
Initial download of the metrics may take a while.