Fig. 10
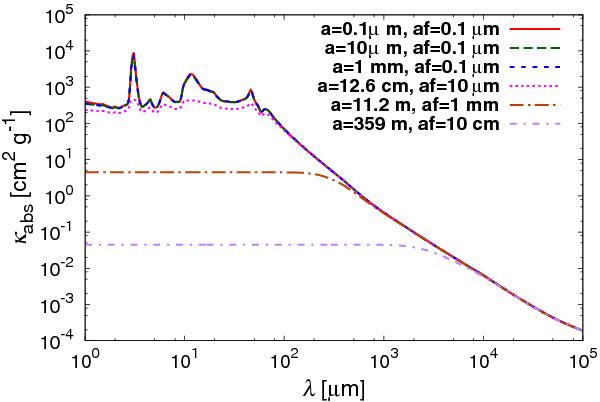
Mass opacity change in the case of fluffy dust growth. Each line shows the mass opacity in the cases of different radii and filling factors, which correspond to open circles in Fig. 9. The dust properties of the lines are as follows: red: a = 0.1 μm, and af = 0.1 μm; green: a = 10 μm, and af = 0.1 μm; blue: a = 1 mm, and af = 0.1 μm; magenta: a = 12.6 cm, and af = 10 μm; brown: a = 11.2 m, and af = 1 mm; purple: a = 359 m, and af = 10 cm.
Current usage metrics show cumulative count of Article Views (full-text article views including HTML views, PDF and ePub downloads, according to the available data) and Abstracts Views on Vision4Press platform.
Data correspond to usage on the plateform after 2015. The current usage metrics is available 48-96 hours after online publication and is updated daily on week days.
Initial download of the metrics may take a while.